
EXTERNAL TRADE PERFORMANCE
JANUARY 2014
(Preliminary)
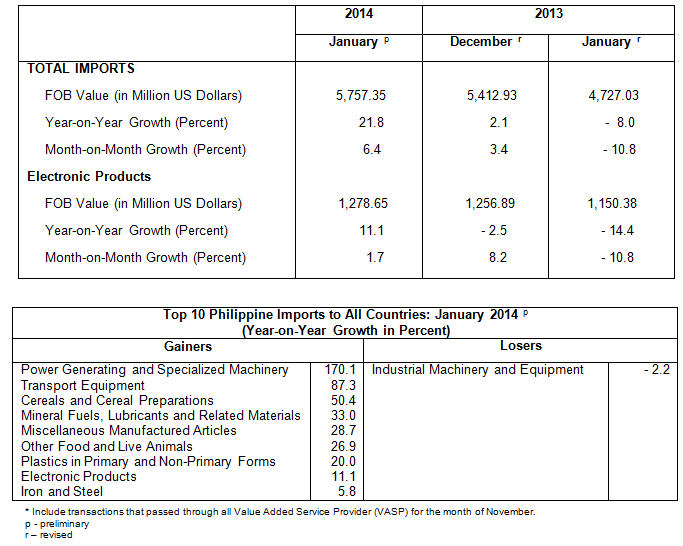
IMPORTED MERCHANDISE FOR JANUARY 2014 EXPANDS BY 21.8 PERCENT
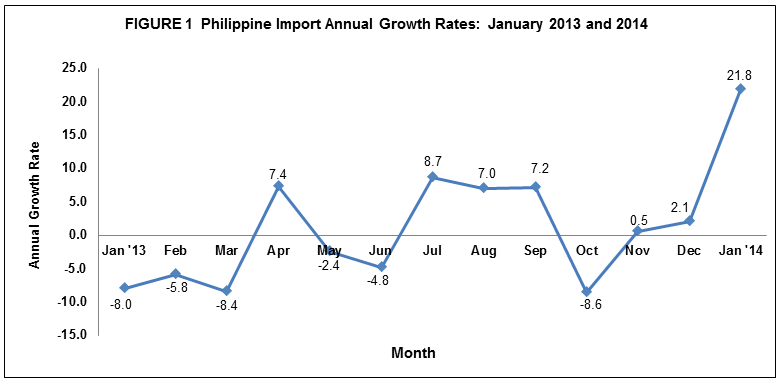
Total imported merchandise for January 2014 amounted to $5.757 billion, representing a 21.8 percent increase from $4.727 billion recorded during the same period a year ago. The positive growth was mainly brought about by the increase of nine major commodities out of the top ten commodities for the month. These are: power generating and specialized machinery; transport equipment; cereals and cereal preparations; mineral fuels, lubricants and related materials; miscellaneous manufactured articles; other food & live animals; plastics in primary and non-primary forms; electronic products; and iron and steel. On a monthly basis, payments for merchandise imports increased by 6.4 percent from $5.413 billion posted in December 2013. However, the balance of trade in goods (BOT-G) for the Philippines in January 2014 registered a deficit of $1.376 billion from $716 million deficit in the same period last year. In terms of total volume of inward shipments (expressed in gross kilos), total imported goods increased compared to the same month a year ago.
IMPORTS ON ELECTRONIC PRODUCTS INCREASE BY 11.1 PERCENT
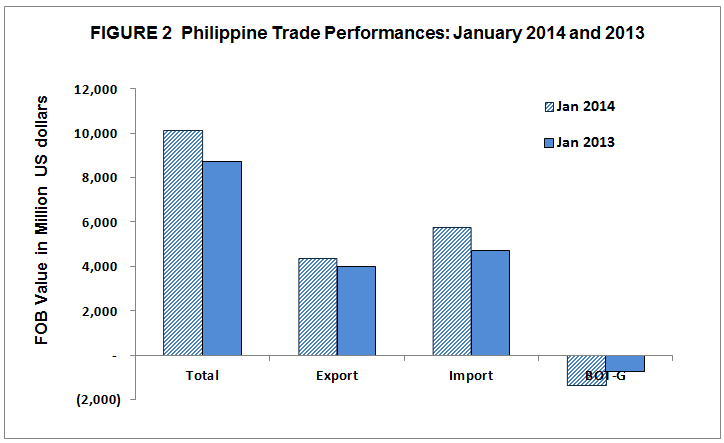
Electronic Products remained as the country’s top imported goods with total bill worth $1.279 billion, accounting for 22.2 percent of the total imports payments in January 2014. It increased by 11.1 percent from $1.150 billion registered in January 2013. Similarly, on a month-on-month basis, Electronic Products grew by 1.7 percent from $1.257 billion posted in December 2013. Components/Devices (Semiconductors), comprising 17.0 percent of the total imports, had the largest share among the major groups of electronic products with import bill worth $978.00 million, increasing by 17.9 percent from $829.47 million recorded in January 2013. However, volume of inward shipments of electronic products decreased compared to the same period a year ago.
Imports of Mineral Fuels, Lubricants and Related Materials ranked second with 21.4 percent share and reported import payment valued at $1.233 billion. It increased by 33.0 percent from $927.20 million in January 2013. Likewise, in terms of volume, it expanded compared with January 2013 recorded volume of inward shipments.
Transport Equipment was recorded as the country’s third top imports with payment valued at $691.67 million or 12.0 percent share to total imports. It increased by 87.3 percent from $369.24 million in same period a year ago. However, its volume of inward shipments declined over a year ago.
Industrial Machinery and Transport Equipment ranked fourth, contributing 4.5 percent share to total import bill amounting to $257.94 million. It decreased by 2.2 percent compared to last year’s value of $263.66 million. On the other hand, monthly comparison showed a 4.9 percent increase.
Cereals and Cereal Preparations, with 3.0 percent share to the total import bill, ranked fifth with value posted at $172.43 million. It increased by 50.4 percent from $114.68 million recorded value during the same month in 2013.
Rounding up the list of the top ten imports for the month of January 2014 were Other Food and Live Animals with import payments of $169.40 million, an increase of 26.9 percent; Plastics in Primary and Non-Primary Forms with import bill of $152.44 million, increasing by 20.0 percent; Iron and Steel with $146.94 million, increasing by 5.8 percent; Miscellaneous Manufactured Articles with import bill worth $130.09 million, expanding by 28.7 percent; and Power Generating and Specialized Machinery with $126.19 million, registering the highest year-on-year change of 170.1 percent among the top ten goods compared to its value a year ago.
Total bill from the top ten imports reached $4.359 billion, or 75.7 percent of the total imports.
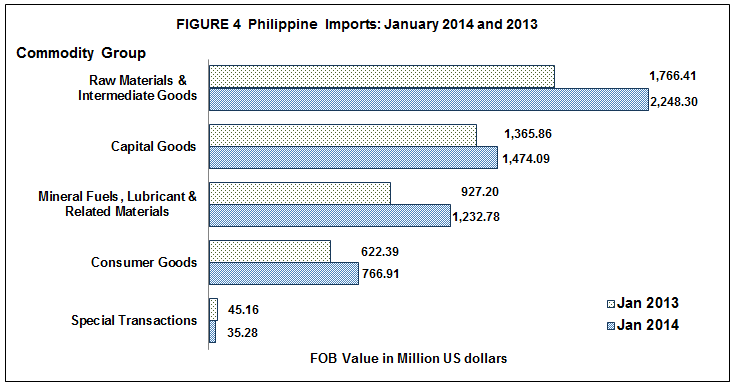
RAW MATERIALS AND INTERMEDIATE GOODS ACCOUNT FOR 39.1 PERCENT OF THE TOTAL IMPORTS
Payments for imports in January 2014 for Raw Materials and Intermediate Goods accounted for 39.1 percent of the total imports and valued at $2.248 billion. It increased by 27.3 percent over last year's figure of $1.766 billion. On a month-on-month basis, purchases also went up by 8.3 percent from $2.076 billion. Semi-Processed Raw Materials had the biggest share of 35.8 percent and valued at $2.060 billion. The volume of shipments for this type of goods also increased compared to shipments a year ago.
Total imports of Capital Goods, comprising 25.6 percent of the total imports, went up by 7.9 percent to $1.474 billion in January 2014 from $1.366 billion in January 2013. On the other hand, its volume of shipment decreased compared to the same month a year ago.
Mineral Fuels, Lubricants and Related Materials with 21.4 percent share to total imports increased by 33.0 percent to $1.233 billion in January 2014 from $927.20 million in January 2013. Among these products, crude petroleum contributed the biggest share of $698.11 million, increasing by 44.2 percent compared to its value a year ago.
Purchases of Consumer Goods recorded a 13.3 percent share or with total import bill valued at $766.91 million in January 2014. It increased by 23.2 percent from $622.39 million registered in January 2013.
Special Transactions went down by 21.9 percent from $45.16 million to $35.28 million in January 2014. Likewise, volume of shipments of this product decelerated compared to the same period last year.
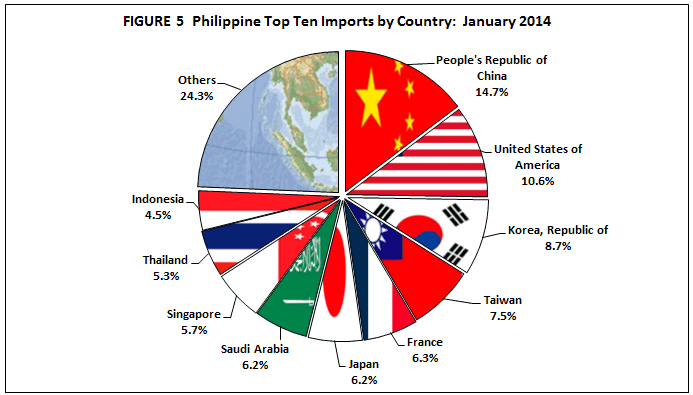
IMPORTS FROM PEOPLE’S REPUBLIC OF CHINA ACCOUNT FOR 14.7 PERCENT
People’s Republic of China was the country’s biggest source of imports with 14.7 percent share. Payments were recorded at $844.04 million, an increase of 36.8 percent from $616.98 million in January 2014. Revenue from country’s exports to China, on the other hand, reached $433.13 million, generating a total trade value of $1.277 billion and $410.91 million trade deficit.
United States of America (USA) including Alaska and Hawaii was second biggest source of imports for January 2014 with 10.6 percent share to the total import bill amounting to $609.87 million and increasing by 19.4 percent from $510.89 million in January 2013. Exports to USA amounted to $605.43 million, yielding a two-way trade value of $1.215 billion and a trade deficit of $4.44 million.
Third in rank was Republic of Korea, accounting for 8.7 percent share of the total import bill in January 2014 with a positive growth of 23.4 percent from $406.10 million to $501.28 million. Exports to this country amounted to $248.65 million resulting to a total trade value of $749.93 million and a trade deficit of $252.62 million.
Taiwan placed fourth accounting for 7.5 percent share of the total import bill in January 2014 or an increase of 28.2 percent to $432.17 million from $337.05 million compared to same period. Exports to Taiwan amounted to $156.85 million resulting to a total trade value of $589.02 and a trade deficit of $275.32 million.
France came fifth, representing a 6.3 percent of the total import bill in January 2014, with import value of $361.58 million. Meanwhile, export receipts from France in January 2014 reached $20.90 million yielding a total trade value of $382.48 million and a trade deficit of $340.68 million.
Other major sources of imports for the month of January 2013 were: Japan including Okinawa, $356.21 million; Saudi Arabia, $355.71 million; Singapore, $329.23 million; Thailand, $307.25 million; and Indonesia, $259.10 million.
Payments for imports from the top ten sources for January 2014 amounted to $4.356 billion or 75.7 percent of the total.
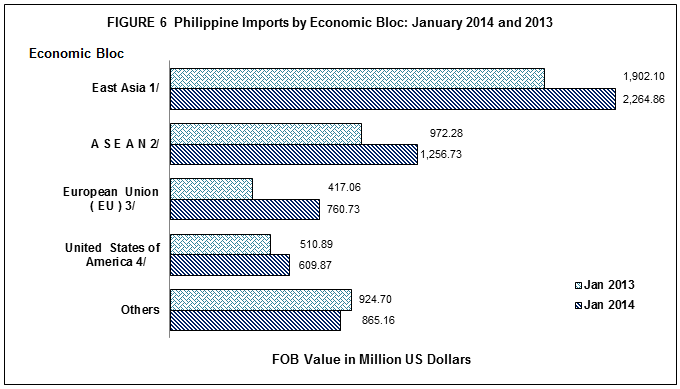
IMPORTS FROM EAST ASIA AMOUNTS TO $2.265 BILLION
The bulk of country’s imports in January 2014 were from East Asia (China, Hong Kong, Japan, Macau, Mongolia, North Korea, South Korea and Taiwan) in terms of economic bloc. It accounted for 39.3 percent of the total imports which valued at $2.265 billion, higher by 19.1 percent from $1.902 billion in January 2013. Total exports to member-countries of East Asia were valued at $2.319 billion resulting to a total trade of $4.584 billion and a balance of trade in goods (BOT-G) surplus of $53.9 million.
January 2014 imports from ASEAN member-countries were valued at $1.257 billion, contributing 21.8 percent share and increasing by 29.3 percent from $972.28 million registered in January 2013. Exports to ASEAN member-countries were worth $747.90 million, resulting to a total trade of $2.005 billion and a trade deficit of $508.83 million.
Imports from European Union were valued at $760.73 million. It increased by 82.4 percent compared to a year ago recorded value of $417.06 million while exports to member-countries of European Union were worth $463.63 million. This aggregated to total trade of $1.224 billion and a trade deficit of $297.10 million.

Technical Note:
Starting with the February 2007 Press Release, analysis and tables are based on the 2004 Philippine Standard Commodity Classification (PSCC) groupings. This is in compliance with NSCB Resolution No. 03, Series of 2005 entitled “Approving and Adopting the 2004 Philippine Standard Commodity Classification” by all concerned government agencies and instrumentalities.