
EXTERNAL TRADE PERFORMANCE
JANUARY 2015
(Preliminary)
|
|
January
|
||
|---|---|---|---|
|
|
2015 p |
2014 r |
|
|
TOTAL IMPORTS FOB Value in Million US Dollars Year-on-Year Growth (Percent) Electronic Products FOB Value in Million US Dollars Year-on-Year Growth (Percent) |
5,108.29 -14.2
1,654.55 28.3 |
5,954.82 24.7
1,290.06 12.0 |
|
|
Top 10 Philippine Imports from All Countries: January 2015 p
(Year-on-Year Growth in Percent)
|
|||
|---|---|---|---|
Gainers |
Losers |
||
|
Electronic Products
|
28.3 |
Transport Equipment
|
-58.1 |
|
Cereals and Cereal Preparation
|
5.3 |
Mineral Fuels, Lubricants and Related Materials
|
-43.4 |
|
|
Iron and Steel
|
-15.0 | |
|
|
Organic and Inorganic Chemicals
|
-13.5 | |
|
|
Plastics in Primary and Non-Primary Forms
|
-10.6 | |
|
Industrial Machinery and Equipment
|
-4.1 | ||
|
Other Food and Live Animals
|
-3.5 | ||
|
Miscellaneous Manufactured Articles
|
-1.8 | ||
p-preliminary, r-revised
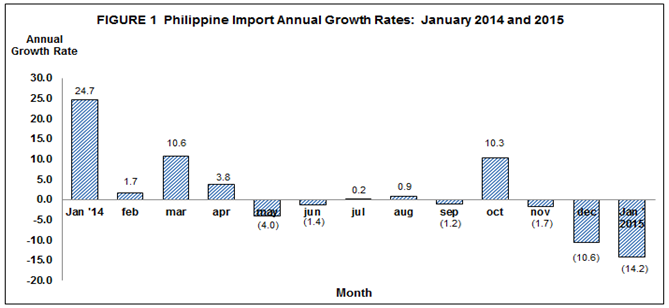
IMPORTS DECLINE BY 14.2 PERCENT IN JANUARY 2015
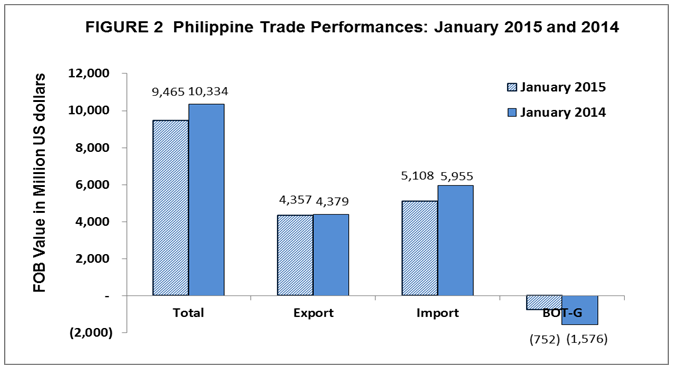
The country’s total external trade in goods for January 2015 amounting to $5.108 billion, declined by 14.2 percent from $5.955 billion recorded during the same period a year ago. The decrease in total imports for this period was due to the negative performance of eight out of the top ten major commodities for the month. These were: Transport Equipment; Mineral Fuels, Lubricants and Related Materials; Iron and Steel; Organic and Inorganic Chemicals; Plastics in Primary and Non-Primary Forms; Industrial Machinery and Equipment; Other Food & Live Animals; Miscellaneous Manufactured Articles.
The balance of trade in goods (BOT-G) in January 2015 registered a deficit of $751.54 million lower than the $1.576 billion trade deficit in the same period last year.
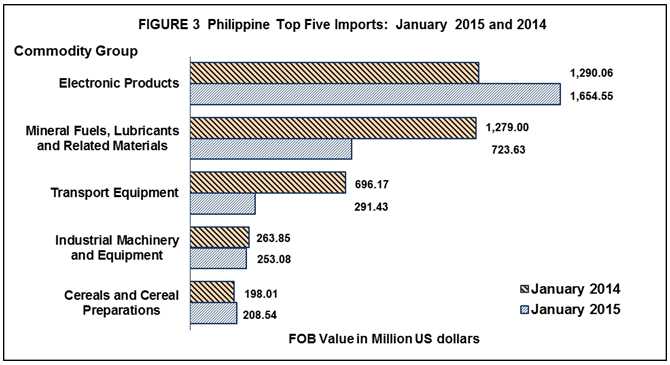
ELECTRONIC PRODUCTS ACCOUNTS FOR 32.4 PERCENT OF IMPORT BILL
Inward shipments of Electronic Products were the top imported commodity in January 2015, accounting for 32.4 percent of the aggregate import bill and value amounting to $1.655 billion. It increased by 28.3 percent over last year's figure of $1.290 billion. Among the major groups of electronic products, Components/Devices (Semiconductors), having the biggest share of 26.2 percent among electronic products, increased by 35.5 percent from $987.11 million in January 2014 to $1.337 billion in January 2015.
Imports of Mineral Fuels, Lubricants and Related Materials ranked second with 14.2 percent share and reported value of $723.63 million in January 2015. It contracted by 43.4 percent from $1.279 billion in January 2014.
Transport Equipment placed third with 5.7 percent share to total imports valued at $291.43 million. It decelerated by 58.1 percent from previous year’s level of $696.17 million.
Industrial Machinery and Equipment, contributing 5.0 percent to the total import bill was the country’s fourth top import for the month amounting to $253.08 million. It went down by 4.1 percent compared to last year’s value of $263.85 million.
Fifth in rank and with 4.1 percent share to the total imports, Cereals and Cereal Preparations recorded $208.54 million worth of imports. It registered a 5.3 percent increase from its year ago level of $198.01 million.
Rounding up the list of the top ten imports for January 2015 were: Other Food and Live Animals valued at $164.05 million; Plastics in Primary and Non-Primary Forms, $136.13 million; Iron and Steel, $134.23 million; Miscellaneous Manufactured Articles amounting to $128.62 million; and Organic and Inorganic Chemicals, $111.14 million.
Aggregate payment for the country’s top ten imports for January 2015 reached $3.805 billion or 74.5 percent of the total import bill.
RAW MATERIALS AND INTERMEDIATE GOODS ACCOUNTS FOR 48.4 PERCENT OF THE TOTAL IMPORTS
Payments for purchases of Raw Materials and Intermediate Goods in January 2015 valued at $2.471 billion and accounted for 48.4 percent of the total imports. It increased by 4.3 percent over last year's figure of $2.370 billion. Semi-Processed Raw Materials had the biggest share of 42.9 percent valued at $2.193 billion.
Payments for inward shipments of Capital Goods accounting for 24.3 percent of the total imports, declined by 17.0 percent from $1.495 billion in January 2014 to $1.241 billion in January 2015.
Purchases of Consumer Goods recorded 12.5 percent share with a total import bill valued at $641.00 million in January 2015. It decreased by 17.1 percent from $773.08 million registered in January 2014.
Mineral Fuels, Lubricants and Related Materials with 14.2 percent share to total imports dropped by 43.4 percent from $1.279 billion in January 2014 to $723.63 million in January 2015. Petroleum crude contributed the biggest share of imports in this commodity group by 7.1 percent.
Special Transactions decreased by 17.5 percent from $38.03 million to $31.37 million in January 2015.

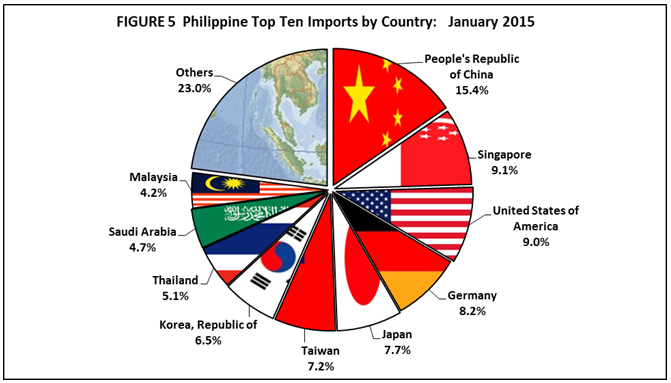
IMPORTS FROM PEOPLE’S REPUBLIC OF CHINA ACCOUNTS FOR 15.4 PERCENT
People’s Republic of China remained as the country’s biggest source of imports with 15.4 percent share in January 2015. Payments were recorded at $788.10 million, a decrease of 8.3 percent from $859.00 million in January 2014. Revenue from country’s exports to China, on the other hand, reached $445.35 million, generating a total trade value of $1.233 billion and $342.75 million trade deficit.
Singapore was the second biggest source of imports for January 2015 with 9.1 percent share to the total import bill amounting to $463.41 million and increased by 39.4 percent from $332.33 million in January 2014. Exports to Singapore amounted to $304.89 million, yielding a two-way trade value of $768.29 million and a trade deficit of $158.52 million.
United States of America (USA) including Alaska and Hawaii came third, contributing 9.0 percent of the total import bill in January 2015, with import value of $460.46 million. It decreased by 31.3 percent from its January 2014 value of $670.46 million. Export receipts to this country in January 2015 reached $693.87 million yielding a total trade value of $1.154 billion and a trade surplus of $233.41 million.
Germany ranked fourth, accounting for 8.2 percent share of the total import bill in January 2015 with a 99.9 percent growth from $209.56 million to $418.82 million in January 2015. Merchandise exports to Germany amounted to $225.60 million resulting to a total trade value of $644.42 million and a trade deficit of $193.22 million.
Fifth in rank was Japan including Okinawa accounting for 7.7 percent share of the total import bill worth $392.39 million in January 2015 and increased by 7.4 percent from $365.36 million in January 2014. Exports to Japan amounted to $882.61 million resulting to a total trade value of $1.275 billion and a trade surplus of $490.22 million.
Other major sources of imports for the month of January 2015 were: Taiwan, $369.48 million; Republic of Korea, $331.11 million; Thailand, $260.65 million; Saudi Arabia, $238.80 million; and Malaysia, $212.61 million.
Aggregate payments for imports from the top ten sources for January 2015 amounted to $3.936 billion or 77.0 percent of the total.
IMPORTED GOODS FROM EAST ASIA ACCOUNTS FOR 39.9 PERCENT
By economic bloc, East Asia (China, Hong Kong, Japan, Macau, Mongolia, North Korea, South Korea and Taiwan) was the biggest source of the country’s imports in January 2015 as it accounted for 39.9 percent of the total imports valued at $2.037 billion. It decreased by 12.9 percent from $2.338 billion in January 2014. Total exports to countries in East Asia amounted to $2.069 billion resulting to a total trade of $4.106 billion and a trade surplus of $32.66 million.
Goods imported from ASEAN member countries were valued at $1.195 billion, contributing 23.4 percent share and decreased by 7.8 percent from $1.296 billion recorded in January 2015. Proceeds from exports to ASEAN member countries were worth $696.28 million, resulting to a total trade of $1.892 billion and a trade deficit of $499.18 million.
Imports from European Union were valued at $698.37 million. It declined by 7.9 percent compared to a year ago value of $758.07 million. Exports to member countries of European Union were worth $510.70 million, resulting to a total trade of $1.209 billion and a trade deficit of $187.67 million.

Technical Notes:
1. Adjustments on electronic import statistics are based on the transactions that pass through the Electronic to Mobile (e2m) of the Bureau of Customs (BOC).
2. Starting with the 2007 Press Release, analysis and tables are based on the 2004 Philippine Standard Commodity Classification (PSCC) groupings. This is in compliance with NSCB Resolution No. 03, Series of 2005 entitled “Approving and Adopting the 2004 Philippine Standard Commodity Classification” by all concerned government agencies and instrumentalities.