
EXTERNAL TRADE PERFORMANCE
July 2012
(Preliminary)
p-preliminary
r-revised

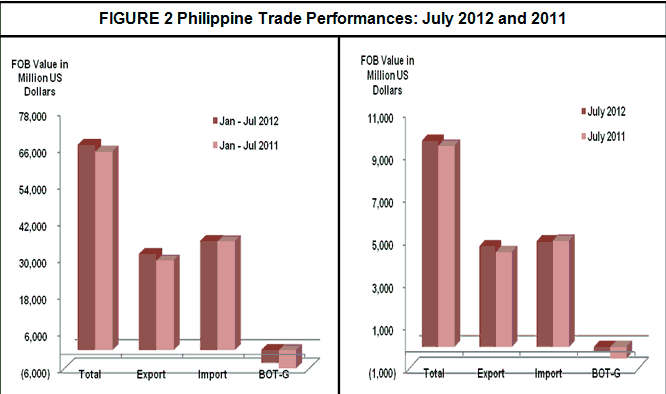
JULY 2012 TOTAL TRADE STANDS AT $9.691 BILLION
Total external trade in goods for July 2012 reached $9.691 billion, representing a 2.4 percent increase from $9.462 billion recorded during the same month in 2011. The increase can be attributed to the 6.0 percent growth of exports to $4.727 billion from $4.460 billion in the same month a year ago. However, total imports marginally declined by 0.8 percent from $5.001 billion in July 2011 to $4.964 billion. Thus, the balance of trade in goods (BOT-G) for the Philippines in July 2012 registered a deficit of $236 million from $541 million deficit in the same period last year.
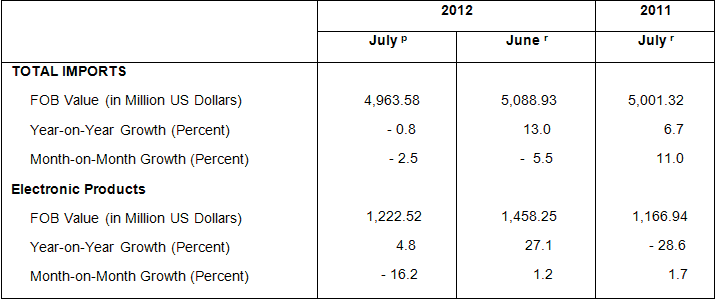
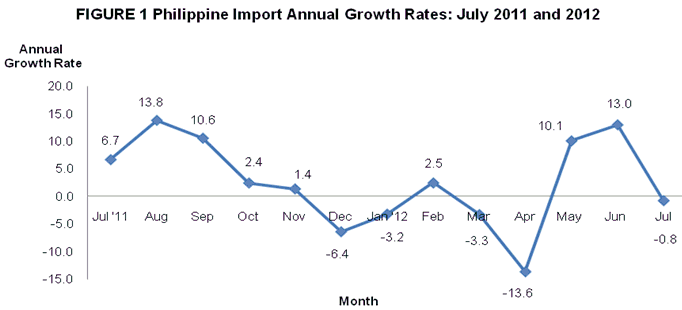
JULY 2012 IMPORTS DROP BY 0.8 PERCENT
The country’s total merchandise imports for July 2012 went down by 0.8 percent from $5.001 billion to $4.964 billion. Similarly, it decreased by 2.5 percent compared to previous month’s level to $5.089 billion. On the other hand, aggregate imports slightly went up by 0.2 percent to $35.712 billion value in the first seven months of 2012 from $35.655 billion for the same period in 2011.
ELECTRONIC PRODUCTS ACCOUNT FOR 24.6 PERCENT OF IMPORT BILL
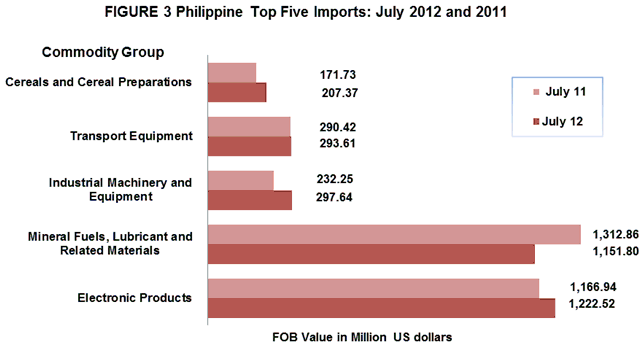
Accounting for 24.6 percent of the aggregate import bill, payments for Electronic Products (including consigned and direct importation using the expanded coverage of electronic products) expanded by 4.8 percent to reported value of $1.223 billion from $1.167 billion in July 2011. Among the major groups of electronic products, Components/Devices (Semiconductors) having the biggest share of 18.2 percent increased by 6.6 percent to $902.66 million from $846.49 million. However, compared to previous month, electronic products as well as the semiconductors went down by 16.2 percent and 20.7 percent from $1.458 billion and $1.139 billion recorded in June 2012 respectively.
Import bill payments for Mineral Fuels, Lubricants and Related Materials ranked second among the top ten imports with 23.2 percent share to total imports. The annual growth rate went down by 12.3 percent from $1.313 billion to $1.152 billion. The contraction in value may be attributed to the 1.9 percent decrease in volume of inward shipments.
Industrial Machinery and Equipment was the PH’s third top import for the month with 6.0 percent share to total imports valued at $297.64 million. It posted a positive year on year change of 28.2 percent among the top ten imports from $232.25 million from previous year’s value. The expansion was brought about by 54.5 percent increase in the volume of inward shipment.
Transport Equipment contributing about 5.9 percent to the total import bill was the fourth top import for the month amounting to $293.61 million. Compared to last year’s amount of $290.42 million, it grew by 1.1 percent. Similarly, volume purchases also went up by 56.5 percent from the same period last year.
Fifth in rank and with 4.2 percent share to the total imports was Cereals and Cereal Preparations, recorded $207.37 million worth of imports from its year ago level of $171.73 million. An annual positive growth of 20.8 percent was shown because of the 42.9 percent increase in volume of imports compared to July 2011.
Rounding up the list of the top ten imports for July 2012 were Organic and Inorganic Chemicals, $139.86 million; Plastics in Primary and Non-Primary Forms, $132.57 million; Telecommunication Equipment and Electrical Machinery, $107.23 million; Iron and Steel, $99.30 million; and Chemical Materials and Products, n.e.s. valued at $81.54 million with the highest growth of 34.3 percent among the top ten imports for July 2012.
Aggregate payment for the country’s top ten imports for July 2012 reached $3.733 billion or 75.2 percent of the total import bill.
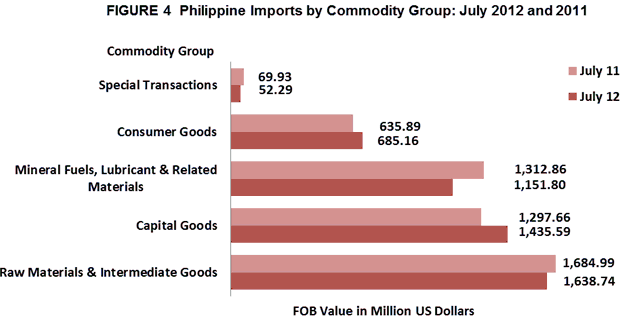
RAW MATERIALS AND INTERMEDIATE GOODS ACCOUNT FOR 33.0 PERCENT OF THE TOTAL IMPORTS
Raw Materials and Intermediate Goods, which comprised 33.0 percent of the total imports in July 2012, year-on-year change went down by 2.7 percent from $1.685 billion to $1.639 billion. The contraction was brought about by the decline in the value of unprocessed raw materials, semi-processed raw materials and materials and accessories for the manufacturer of electrical equipment.
Accounting for 28.9 percent of the total imports, payments for Capital Goods amounted to $1.436 billion or 10.6 percent increment over last year's figure of $1.298 billion. Compared to the previous month’s level, purchases went down by 18.5 percent from $1.762 billion. Increase in the import bill can be accounted for by 42.8 percent increase in volume of purchases of capital goods.
Purchases of Consumer Goods amounted to $685.16 million or a positive growth of 7.7 percent from $635.89 million in July 2011. The increase was brought about by the 20.8 percent increase in purchases of passenger car and motorized cycle.
Imports of commodities under Special Transactions valued at $52.29 million dropped by 25.2 percent from $69.93 million recorded in July 2011. Similarly, total volume of inward manifest registered a 34.5 percent drop compared to its a year ago volume of importation.
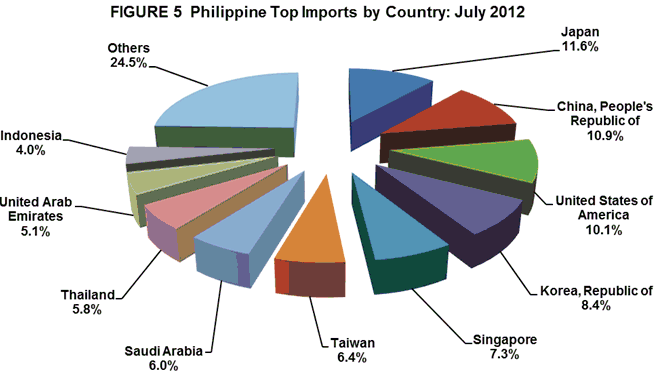
IMPORTS FROM JAPAN ACCOUNT FOR 11.6 PERCENT
Japan including Okinawa was the country’s biggest source of imports in July 2012 with 11.6 percent share. Payments were recorded at $573.57 million, an increase of 19.1 percent from $481.44 million in July 2011. Revenue from PH’s exports to Japan, on the other hand, reached $770.08 million, generating a total trade value of $1.344 billion and $196.51 million trade surplus for the Philippines. The increase in the inward purchases from Japan was based on imported commodities like wafers and discs, electrically circuit-programmed, whether or not coated on one side with gold or aluminum.
People’s Republic of China was the second top source of imports with 10.9 percent share to the total import bill amounting to $538.81 million, lower by 6.7 percent from $577.79 million in July 2011. Exports to People’s Republic of China amounted to $501.34 million, yielding a two-way trade value of $1.040 billion and a trade deficit for PH of $37.47 million.
United States of America (USA) including Alaska and Hawaii came third, accounting for 10.1 percent share of the total import bill in July 2012 with positive growth of 8.7 percent from $461.01 million to $501.28 million. Exports to USA amounted to $668.69 million resulting to a total trade value of $1.170 billion and a trade surplus of $167.41 million.
Republic of Korea ranked fourth among the top sources of imports for the country accounting for 8.4 percent share of the total import bill in July 2012. It increased by 26.2 percent to $419.30 million from $332.25 million. On the other hand, exports to Republic of Korea amounted to $191.49 million resulting to a total trade value of $610.79 million and a trade deficit of $227.81 million.
Fifth in rank was Singapore, representing 7.3 percent of the total import bill in July 2012 or a decrease of 0.2 percent from $361.93 million to $361.32 million in the same month last year. Exports to Singapore amounted to $834.01 million resulting to a total trade value of $1.195 billion and a trade surplus of $472.69 million.
Other major sources of imports for the month of July 2012 were Taiwan, $317.08 million (electronic products and other petroleum products); Saudi Arabia, $297.05 million (petroleum products); Thailand, $285.56 million (other petroleum products, electronic products and motor vehicles); United Arab Emirates, $253.03 million (petroleum products); and Indonesia $198.86 million (other petroleum products and motor vehicles).
Payments for imports from the top ten sources for July 2012 amounted to $3.746 billion or 75.5 percent of the total.
IMPORTS FROM EAST
Philippines’ total imports in July 2012 from East Asia accounted for 39.9 percent of the county’s total imports with total payments of $1.979 billion or a positive annual growth of 8.2 percent from July 2011 level of $1.829 billion. Total exports to member-countries of East Asia were valued at $1.982 billion, resulting to a total trade of $3.961 billion and a balance of trade in goods (BOT-G) surplus of $2.07 million.
Imports from ASEAN member-countries recorded at $1.188 billion, contributed a 23.9 percent share to total imports. It grew by 4.3 percent compared to $1.139 billion value in July 2011. On the other hand, exports to ASEAN member-countries worth $1.298 billion resulted to a total trade of $2.486 billion and a trade surplus of $110.66 million.
July 2012 imports from European Union were valued at $315.14 million while exports to member-countries of European Union were worth $503.91 million. These aggregated to a total trade value of $819.05 million and a trade surplus of $188.77 million.

Notes: 1/ - includes China, Hong Kong, Japan, Macau, Mongolia, N, Korea, S. Korea, Taiwan
2/ - includes Brunei Darussalam, Cambodia, Indonesia, Laos, Malaysia, Myanmar, Singapore, Thailand, Vietnam
3/ - includes Alaska and Hawaii
4/ - includes Austria, Belgium, Bulgaria, Cyprus, Czech Republic, Denmark, Estonia,
Finland, France, Germany, Greece, Hungary, Ireland, Italy, Latvia, Lithuania,
Luxembourg, Malta, Netherlands, Poland, Portugal, Romania, Slovakia, Slovenia,
Spain, Sweden and UK Great Britain
Technical Notes:
- Adjustments on electronic import statistics are based on the transactions that pass through the Electronic to Mobile (e2m) of the Bureau of Customs (BOC).
-
Starting with the 2007 Press Release, analysis and tables are based on the 2004 Philippine Standard Commodity Classification (PSCC) groupings. This is in compliance with NSCB Resolution No. 03, Series of 2005 entitled “Approving and Adopting the 2004 Philippine Standard Commodity Classification” by all concerned government agencies and instrumentalities.
(Sgd.) CARMELITA N. ERICTA
Administrator
Source: Foreign Trade Statistics Section
Industry and Trade Statistics Department
National Statistics Office
Manila, Philippines