
EXTERNAL TRADE PERFORMANCE
JUNE 2016
(Preliminary)
|
|
June
|
||
|---|---|---|---|
|
|
2016 p |
2015 r |
|
|
TOTAL IMPORTS FOB Value in Million US Dollars Year-on-Year Growth (Percent) Electronic Products FOB Value in Million US Dollars Year-on-Year Growth (Percent) |
6,852.91 15.4
1,697.07 -15.8 |
5,940.76 23.0
2,015.54 127.1 |
|
|
Top 10 Philippine Imports from All Countries: June 2016 p
(Year-on-Year Growth in Percent)
|
|||
|---|---|---|---|
Gainers |
Losers |
||
|
Telecommunication Equipment and Electrical Machinery
|
91.5 |
Electronic Products
|
-15.8 |
|
Plastics in Primary and Non-Primary Forms
|
71.6 |
Mineral Fuels, Lubricants and Related Materials
|
-5.1 |
|
Iron and Steel
|
67.0 |
|
|
|
Industrial Machinery and Equipment
|
57.8 | ||
|
Power Generating and Specialized Machinery |
57.8 |
|
|
|
Miscellaneous Manufactured Articles
|
55.5 | ||
|
Transport Equipment
|
50.7 | ||
|
Other Food and Live Animals
|
15.9 | ||
p-preliminary, r-revised
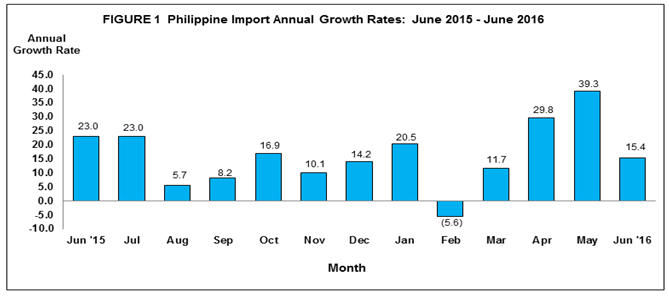
IMPORTS INCREASED BY 15.4 PERCENT IN JUNE 2016
The total imported goods by the country for the month of June 2016 amounted to $6.853 billion, an increase of 15.4 percent from $5.941 billion recorded during the same period a year ago. The increase was due to the positive growth rates of eight out of the top ten major imported commodities for the month led by telecommunication equipment and electrical machinery (91.5%). The other seven were: plastics in primary and non-primary forms (71.6%), iron and steel (67.0%), industrial machinery and equipment (57.8%), power generating and specialized machinery (57.8%), miscellaneous manufactured articles (55.5%), transport equipment (50.7%), and other food and live
animals (15.9%). (Table 2)
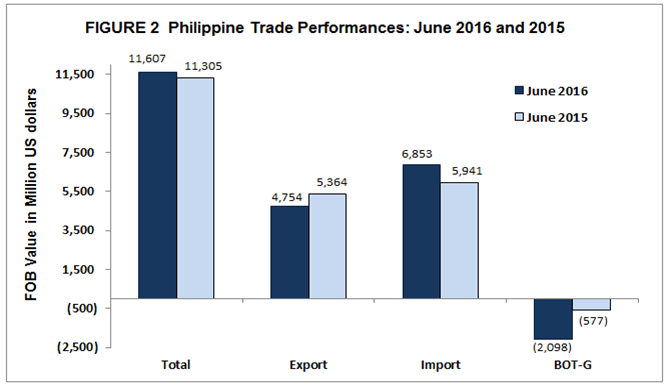
Cumulative imports for January to June 2016 amounted to $38.746 billion, an increase of 17.7 percent compared with $32.917 billion in the same period of last year. The balance of trade in goods (BOT-G) for the Philippines in June 2016, registered a deficit of $2.098 billion, higher than the $576.80 million trade deficit in the same month last year. (Table 1)
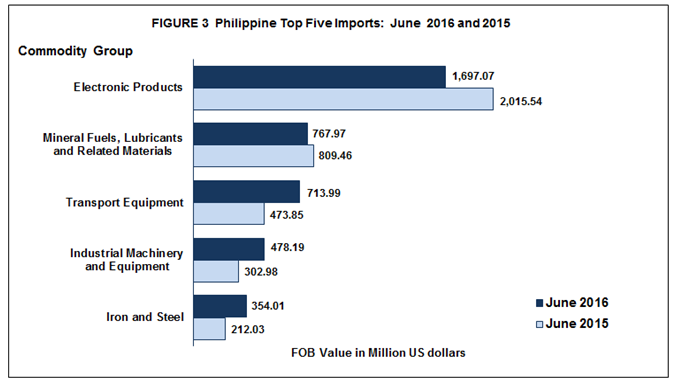
ELECTRONIC PRODUCTS ACCOUNT FOR 24.8 PERCENT SHARE OF IMPORT BILL
Total payment for the country’s top ten imports for June 2016 reached $5.057 billion or 73.8 percent share of the total import bill. (Table 2)
Inbound shipments of Electronic Products in June 2016 accounted for 24.8 percent share of the total import bill with value amounting to $1.697 billion. It decreased by 15.8 percent over the last year's figure of $2.016 billion. Components/Devices (Semiconductors), had the biggest share of 16.8 percent among electronic products, however, it went down by 30.2 percent from $1.653 billion in June 2015 to $1.155 billion in June 2016.
Minerals Fuels, Lubricants and Related Materials placed second with 11.2 percent share to total imports valued at $767.97 million. This registered a decrease of 5.1 percent from its previous year’s level of $809.46 million.
Transport Equipment, contributing 10.4 percent to the total import bill was the country’s third top import for the month amounting to $713.99 million. It rose by 50.7 percent compared to last year’s value of $473.85 million.
Imports of Industrial Machinery and Equipment ranked fourth with 7.0 percent share and reported value of $478.19 million in June 2016. It accelerated by 57.8 percent from $302.98 million in June 2015.
Iron and Steel ranked fifth, with 5.2 percent share to the total imports which was valued at $354.01 million in June 2016. It registered a 67.0 percent increase from its year ago level of $212.03 million.
Rounding up the list of the top ten imports for June 2016 were:
- Other Food and Live Animals, $256.26 million;
- Miscellaneous Manufactured Articles, $210.76 million;
- Telecommunication Equipment and Electrical Machinery, $205.13 million ;
- Plastics in Primary and Non-Primary Forms, $187.57 million; and
- Power Generating and Specialized Machinery, $186.05 million.
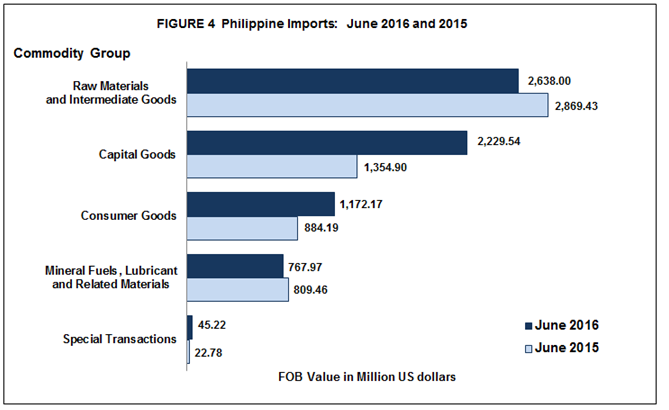
PURCHASES OF RAW MATERIALS AND INTERMEDIATE GOODS ACCOUNT FOR 38.5 PERCENT OF THE TOTAL IMPORTS
Total importation of Raw Materials and Intermediate Goods in June 2016 were valued at $2.638 billion, accounting for 38.5 percent share of the total imports. It decreased by 8.1 percent over last year's figure of $2.869 billion. Semi-Processed Raw Materials, having the biggest share of this commodity group at 36.1 percent was valued at $2.471 billion. It went down by 7.8 percent compared with $2.680 billion value in June 2015.
Payments for inward shipments of Capital Goods accounted for 32.5 percent of the total imports. It increased by 64.6 percent to $2.230 billion in June 2016 from $1.355 billion in June 2015. (Table 3)
Purchases of Consumer Goods recorded 17.1 percent share with a total import bill valued at $1.172 billion in June 2016. It recorded a positive growth of 32.6 percent from $884.19 million registered in June 2015.
Mineral Fuels, Lubricants and Related Materials with 11.2 percent share to total imports, decreased by 5.1 percent from $809.46 million in June 2015 to $767.97 million in June 2016. Other mineral fuel and lubricants such as gas oils, regular and premium unleaded motor spirit and aviation spirit contributed the biggest share of imports in this commodity group at 5.4 percent and valued $369.64 million. (Table 3)
Furthermore, imports of Special Transactions went up by 98.5 percent to $45.22 million recorded in June 2016 from $22.78 million in June 2015.
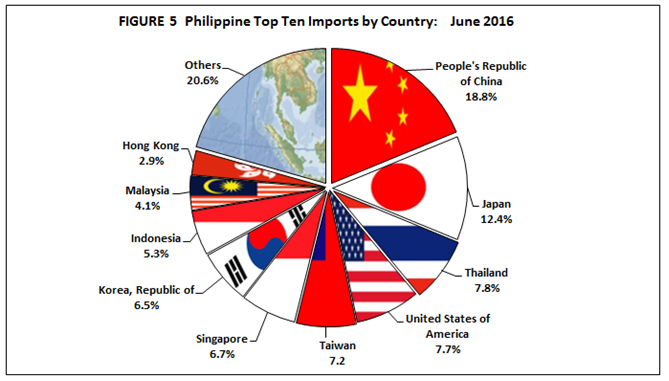
IMPORTS FROM PEOPLE’S REPUBLIC OF CHINA ACCOUNT FOR 18.8 PERCENT
Aggregate payments from the top ten imports sources for June 2016 amounted to $5.440 billion or 79.4 percent of the total import bill. (Table 4)
People’s Republic of China remained as the country’s biggest source of imports at 18.8 percent share in June 2016. Payments were recorded at $1.287 billion, an increase of 45.8 percent from $882.92 million in June 2015. Revenue from the country’s exports to People’s Republic of China, on the other hand, reached $536.14 million, generating a total trade value of $1.823 billion and $750.96 million trade deficit. (Tables 4 and 5)
Japan including Okinawa, came second, contributing 12.4 percent or $852.20 million to the total import bill in June 2016. It grew by 86.1 percent from its June 2015 value of $457.96 million. Export receipts from Japan in June 2016 reached $980.57 million yielding a total trade value of $1.833 billion and a favourable balance of trade of $128.37 million. (Tables 4 and 5)
Thailand ranked third, accounting for 7.8 percent share of the total import bill in June 2016, a positive growth of 23.7 percent to $531.89 million in June 2016 from $429.98 million in June 2015. Exports to this country amounted to $174.63 million resulting to a total trade value of $706.52 million and a trade deficit of $357.26 million.
United States of America (USA), including Alaska and Hawaii, was the fourth biggest source of imports for June 2016 with 7.7 percent share to the total import bill amounting to $530.50 million, an decrease of 25.5 percent from $712.03 million in June 2015. Exports to USA amounted to $741.00 million, yielding a two-way trade value of $1.272 billion and a trade surplus of $210.50 million.
Taiwan placed fifth, accounting for 7.2 percent share of the total import bill worth $490.31 million in June 2016. It went down by 16.3 percent from $585.63 million in June 2015. Exports to Taiwan amounted to $175.29 million resulting to a total trade value of $665.59 million and a trade deficit of $315.02 million. (Tables 4 and 5).
Other major sources of imports for the month of June 2016 included in Top Ten Countries were: Singapore, $457.31 million; Republic of Korea, $444.47 million; Indonesia, $365.86 million; Malaysia (includes Sabah and Sarawak), $280.53 million; and Hong Kong, $200.05 million.
Moreover, imports from Other Countries was valued at $1.413 billion and accounted for 20.6 percent of the total imports for the month of June 2016. Among the other countries, Germany recorded the highest import source at $155.35 million or 2.3 percent of the total.
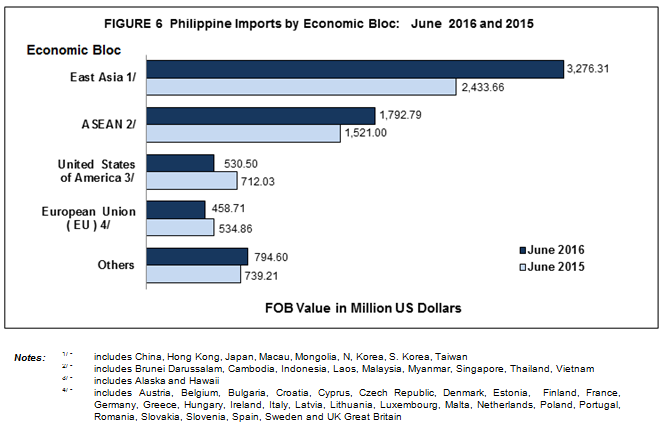
IMPORTS FROM COUNTRIES IN EAST ASIA ACCOUNT FOR 47.8 PERCENT
By economic bloc, East Asia (China, Hong Kong, Japan, Macau, Mongolia, North Korea, South Korea and Taiwan) was the biggest source of the country’s imports in June 2016 as it accounted for 47.8 percent of the total imports valued at $3.276 billion. It increased by 34.6 percent from $2.434 billion in June 2015. Total exports to countries of East Asia amounted to $2.441 billion resulting to a total trade of $5.717 billion and a trade deficit of $835.17 million. (Table 4a and 5a)
Commodities imported from ASEAN member countries were valued at $1.793 billion, contributing 26.2 percent share to total and registered an increase of 17.9 percent from $1.521 billion recorded in June 2015. Proceeds from exports to ASEAN member countries were worth $674.65 million, resulting to a total trade of $2.467 billion and a trade deficit of $1.118 billion. (Table 4a and 5a)
Imports from European Union were valued at $458.71 million. It dropped by 14.2 percent compared to a year ago value of $534.86 million. Exports to member countries of European Union were worth $571.48 million, resulting to a total trade of $1.030 billion and a trade surplus of $112.76 million. (Table 4a and 5a)
Technical Notes
Import trade statistics are compiled by the Philippine Statistics Authority (PSA) from copies of import documents submitted to the Bureau of Customs (BOC) by importers or their authorized representatives as required by law. PSA collects a copy of the accomplished forms by the importer. These are the following import documents collected and processed by PSA:
- Import Entry and Internal Revenue Declaration (BOC IEIRD Form 236)
- Informal Import Declaration and Entry (BOC Form 177)
- PEZA Warehousing Entry (BOC Form 242 CEWE)
Moreover, an electronic copy of the IEIRD, or called Single Administrative Document (SAD), is utilized to capture the monthly import figures. SAD-IEIRD is an on-line submission of import documents either by brokers or companies. These are transactions that pass through the Automated Cargo Operating System (ACOS) or now called the e2m (electronic to mobile) customs system; a system implemented through the BOC e-Customs Project. The output of this system is provided by BOC to PSA on a monthly basis through email.
All documents (hard copies and e-files) received before the cut-off date which is every 10th day of the month are compiled, processed and generated in a monthly statistical tables for the preparation of Press Release. All documents received after the cut-off date, however, are processed and included in the generation of the revised statistical tables. Processing includes coding, editing, review and validation. Revised statistical tables are made available 10 to 15 working days after the press release date.
The Press Release is due every 25th day of each month. However, if the 25th day falls on a Saturday, release will be on Friday but if it falls on a Sunday or Monday the release will be on Tuesday. If the release date falls on holiday, the date of release is moved accordingly.
The 2004 Philippine Standard Commodity Classification (PSCC) is used to classify the commodities at the most detailed level for statistical purposes.
Detailed data on international merchandise trade statistics are available at Philippine Statistics Authority, Economic Sector Statistics Service, Trade Statistics Division (Telephone Number: 376-19-75).