
EXTERNAL TRADE PERFORMANCE
MARCH 2013
(Preliminary)
p-preliminary
r-revised

MARCH 2013 TOTAL TRADE STAND AT $9.251 BILLION
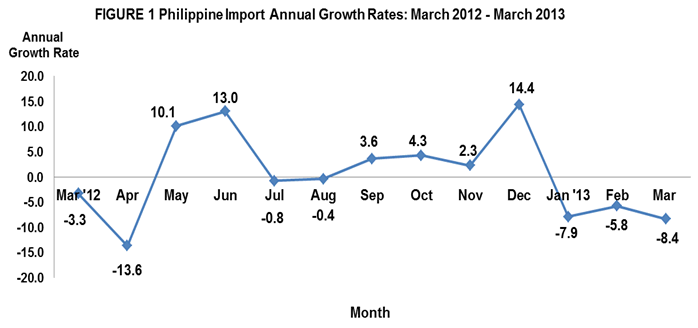
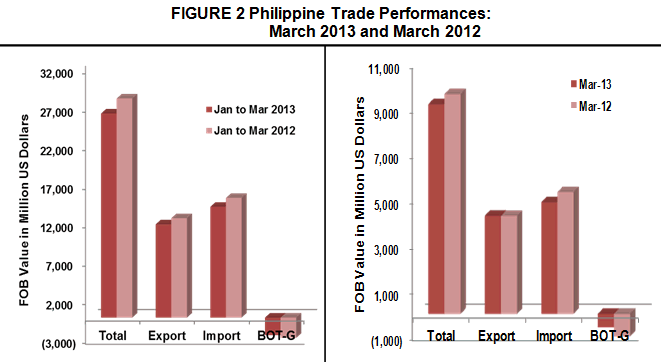
Total external trade in goods for March 2013 reached $9.251 billion, representing a 4.6 percent decline from $9.694 billion recorded during the same month in 2012. This was due to the 8.4 percent downward trend of total imports from $5.371 billion to $4.922 billion in March 2013. On the contrary, exports showed a slight 0.1 percent increase to $4.329 billion from $4.323 billion in March 2012. Thus, the balance of trade in goods (BOT-G) for the Philippines in March 2013 registered a deficit of $593 million from $1.048 billion deficit in the same period last year.
MARCH 2013 IMPORTS DOWN BY 8.4 PERCENT
The country’s total merchandise imports for this month went down by 8.4 percent from $5.371 billion to $4.922 billion in March 2013. However, it increased by 4.6 percent from $4.707 billion compared to previous month’s level. The down fall was supported by five out of 10 major commodity groups whose year-on-year change was negative. These were as follows: mineral fuels, lubricants and related materials; organic and inorganic chemicals; plastics in primary and non-primary forms; industrial machinery and equipment; and electronic products. Likewise, aggregate imports for the first quarter of 2013 amounting to $14.357 billion showed a 7.4 percent decline compared to $15.509 billion in the same quarter last year.
ELECTRONIC PRODUCTS ACCOUNT FOR 25.3 PERCENT OF IMPORT BILL
Accounting for 25.3 percent of the aggregate import bill, payments for Electronic Products (including consigned and direct importation using the expanded coverage of electronic products) in March 2013 amounted to $1.246 billion. It went down by 0.6 percent over last year's figure of $1.254 billion. On a monthly basis, it fell by 0.1 percent from $1.248 billion recorded in February 2013.. Among the major groups of electronic products, Components/Devices (Semiconductors), having the biggest share of 19.4 percent, increased by 3.4 percent to $954.97 million in March 2013 from $923.68 million in March 2012.
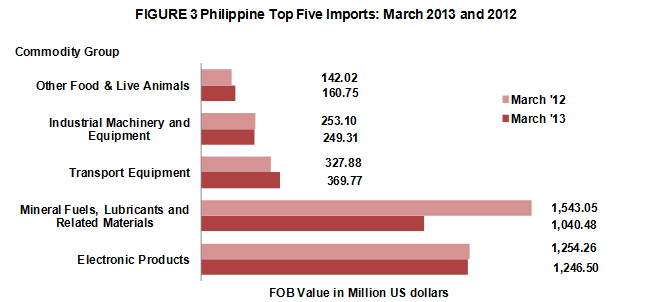
Imports of Mineral Fuels, Lubricants and Related Materials ranked second with 21.1 percent share and posted a negative annual growth rate of 32.6 percent from reported value of $1.543 billion in March 2012 to $1.040 billion in March 2013.
Transport Equipment was the PH’s third top import for the month with 7.5 percent share to total imports valued at $369.77 million in March 2013. This figure went up by 12.8 percent from previous year level of $327.88 million.
Industrial Machinery and Equipment, contributing 5.1 percent to the total import bill was the PH’s fourth top import for the month amounting to $249.31 million. It decelerated by 1.5 percent compared to last year’s value of $253.10 million.
Fifth in rank and with 3.3 percent share to the total imports, Other Food and Live Animals recorded $160.75 million worth of imports, higher by 13.2 percent from its year ago level of $142.02 million.
Rounding up the list of the top ten imports for March 2013 were Iron and Steel valued at $132.01 million; Metalliferous Ores and Metal Scrap amounting to $127.64 million and registering the highest annual growth rate of 108.1 percent among the top ten imports; Plastics in Primary and Non - Primary Forms, $121.91 million; Telecommunication Equipment and Electrical Machinery, $114.05 million; and Organic and Inorganic Chemicals, $100.88 million.
Aggregate payment for the country’s top ten imports for March 2013 reached $3.663 billion or 74.4 percent of the total import bill.
RAW MATERIALS AND INTERMEDIATE GOODS ACCOUNT FOR 38.7 PERCENT OF THE TOTAL IMPORTS
Accounting for 38.7 percent of the total imports, payments in March 2013 for Raw Materials and Intermediate Goods amounted to $1.904 billion or a 1.5 percent increment over last year's figure of $1.875 billion. Compared to the previous month’s level, purchases also went up by 13.0 percent from $1.685 billion. Semi-Processed Raw Materials had the biggest share of 33.5 percent and valued at $1.651 billion.
Capital Goods, which comprised 26.9 percent of the total imports, rose by 0.8 percent year-on-year to $1.323 billion from $1.313 billion.
Mineral Fuels, Lubricants and Related Materials with 21.1 percent share to total imports declined by 32.6 percent from $1.543 billion to $1.040 billion in March 2013.
Purchases of Consumer Goods amounted to $612.50 million or a 3.2 percent growth from $593.79 million in March 2012 while Special Transactions went down by 8.9 percent from $46.50 million to $42.38 million in March 2013.

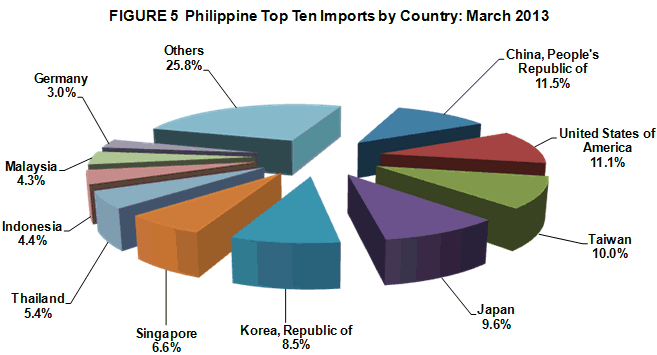
IMPORTS FROM PEOPLE’S REPUBLIC OF CHINA ACCOUNT FOR 11.5 PERCENT
People’s Republic of China was the country’s biggest source of imports for March 2013 with 11.5 percent share of the total import bill, higher by 0.4 percent to $564.45 million from $562.39 million in March 2012. Exports to China amounted to $570.19 million, yielding a two-way trade value of $1.135 billion and a trade surplus for PH of $5.74 million.
United States of America (USA) including Alaska and Hawaii was the second biggest source of imports with 11.1 percent share. Payments were recorded at $545.03 million, an increase of 11.3 percent from $489.82 million in March 2012. Revenue from PH’s exports to USA, on the other hand, reached $621.44 million, generating a total trade value of $1.166 billion and $76.41 million trade surplus for the Philippines.
Taiwan came third, accounting for about 10.0 percent share of the total import bill in March 2013 with positive growth of 55.7 percent to $489.87 million from $314.72 million. Exports to Taiwan amounted to $146.72 million resulting to a total trade value of $636.59 million and a trade deficit of $343.16 million.
Japan including Okinawa settled fourth accounting for 9.6 percent share of the total import bill in March 2013 or a decrease of 19.4 percent from $583.60 million during the same month in 2012 to $470.67 million in March 2013. Exports to Japan amounted to $801.69 million resulting to a total trade value of $1.272 billion and a trade surplus of $331.02 million.
Fifth in rank was Republic of Korea, representing 8.5 percent of the total import bill in March 2013, amounted to $416.89 million. Meanwhile, export receipts from Republic of Korea in March 2013 reached $318.73 million yielding a total trade value of $735.62 million and a trade deficit of $98.16 million.
Other major sources of imports for the month of March 2013 were Singapore, $324.63 million; Thailand $267.94 million; Indonesia, $217.34 million; Malaysia (including Sabah and Sarawak), $211.44 million; and Germany, $146.04 million.
Payments for imports from the top ten sources for March 2013 amounted to $3.654 billion or 74.2 percent of the total.
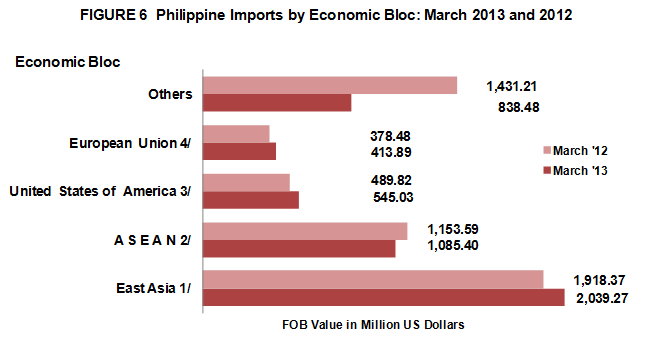
IMPORTS FROM EAST ASIA WORTH $2.039 BILLION
Philippines total imports in March 2013 with East Asia (China, Hong Kong, Japan, Macau, Mongolia, North Korea, South Korea and Taiwan) accounted for 41.4 percent of the county’s total imports with total payments of $2.039 billion or a positive annual growth of 6.3 percent from March 2012 level of $1.918 billion. Total exports to member-countries of East Asia were valued at $2.207 billion, resulting to a total trade of $4.246 billion and a balance of trade in goods (BOT-G) surplus of $167.49 million.
Imports from ASEAN member-countries in March 2013, registered at $1.085 billion, contributed 22.1 percent share, lower by 5.9 percent from $1.154 billion registered in March 2012. Exports to ASEAN member-countries worth $640.24 million resulted to a total trade of $1.726 billion and a trade deficit of $445.16 million.
March 2013 imports from European Union were valued at $413.89 million. It grew by 9.4 percent compared to a year ago recorded value of $378.48 million while exports to member-countries of European Union were worth $581.19 million. This aggregated to total trade of $995.08 million and a trade surplus of $167.30 million.
Notes:
1/ - includes China, Hong Kong, Japan, Macau, Mongolia, N, Korea, S. Korea, Taiwan
2/ - includes Brunei Darussalam, Cambodia, Indonesia, Laos, Malaysia, Myanmar, Singapore, Thailand, Vietnam
3/ - includes Alaska and Hawaii
4/ - includes Austria, Belgium, Bulgaria, Cyprus, Czech Republic, Denmark, Estonia, Finland, France, Germany,
Greece, Hungary, Ireland, Italy, Latvia, Lithuania, Luxembourg, Malta, Netherlands, Poland, Portugal,
Romania, Slovakia, Slovenia, Spain, Sweden and UK Great Britain
Technical Notes:
- Adjustments on electronic import statistics are based on the transactions that pass through the Electronic to Mobile (e2m) of the Bureau of Customs (BOC).
- Starting with the 2007 Press Release, analysis and tables are based on the 2004 Philippine Standard Commodity Classification (PSCC) groupings. This is in compliance with NSCB Resolution No. 03, Series of 2005 entitled “Approving and Adopting the 2004 Philippine Standard Commodity Classification” by all concerned government agencies and instrumentalities.
CARMELITA N. ERICTA
Administrator
Source: Foreign Trade Statistics Section
Industry and Trade Statistics Department
National Statistics Office
Manila, Philippines