
EXTERNAL TRADE PERFORMANCE
MARCH 2015
(Preliminary)
|
|
March
|
||
|---|---|---|---|
|
|
2015 p |
2014 r |
|
|
TOTAL IMPORTS FOB Value in Million US Dollars Year-on-Year Growth (Percent) Electronic Products FOB Value in Million US Dollars Year-on-Year Growth (Percent) |
5,112.61 -6.8
1,271.33 5.4 |
5,485.68 10.8
1,206.67 -3.6 |
|
|
Top 10 Philippine Imports from All Countries: March 2015 p
(Year-on-Year Growth in Percent)
|
|||
|---|---|---|---|
Gainers |
Losers |
||
|
Cereals and Cereal Preparation
|
135.9 |
Mineral Fuels, Lubricants and Related Materials
|
-47.3 |
|
Feeding Stuff for Animals (Not Including Unmilled Cereals)
|
48.2 |
Plastics in Primary and Non-Primary Forms
|
-16.9 |
|
Medicinal and Pharmaceutical Products
|
13.4 |
|
|
|
Transport Equipment
|
8.4 |
|
|
|
Electronic Products |
5.4 |
|
|
|
Organic and Inorganic Chemicals
|
5.3 |
|
|
|
Industrial Machinery and Equipment
|
4.2 |
|
|
|
Other Food and Live Animals
|
2.1 | ||
p-preliminary, r-revised
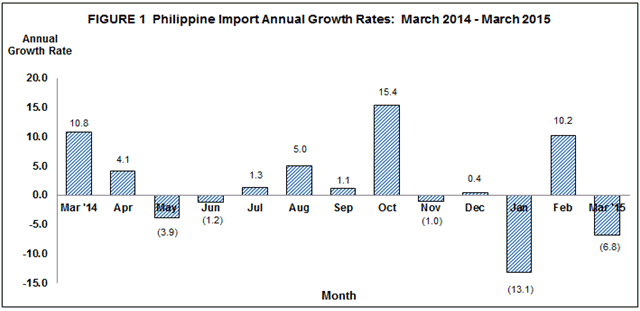
IMPORTS DECLINED BY 6.8 PERCENT IN MARCH 2015
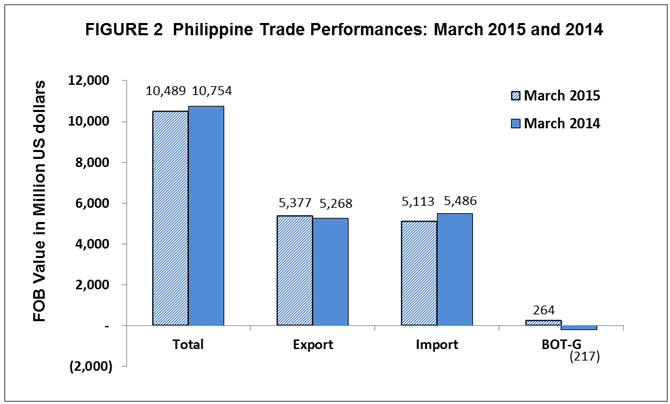
The country’s total imported goods for March 2015 amounted to $5.113 billion, a decrease of 6.8 percent from $5.486 billion recorded during the same period a year ago. The decline in total imports for this period was due to the negative performance of two out of the top ten major commodities for the month. These were: Mineral Fuels, Lubricants and Related Materials; and Plastics in Primary and Non-Primary Forms. Of the major commodities that caused the decline in the country’s imports, inward shipments of Mineral Fuels, Lubricants and Related Materials showed a remarkable 47.3 percent decrease (an equivalent of $611.86 million) in the same month of previous year’s level.
Cumulative imports for the first three months of 2015 amounted to $15.682 billion, a 4.1 percent decrease compared with $16.348 billion in the same period of last year.
The balance of trade in goods (BOT-G) for the Philippines in March 2015 registered a surplus of $264.11 million compared to the $217.27 million deficit in the same period last year.
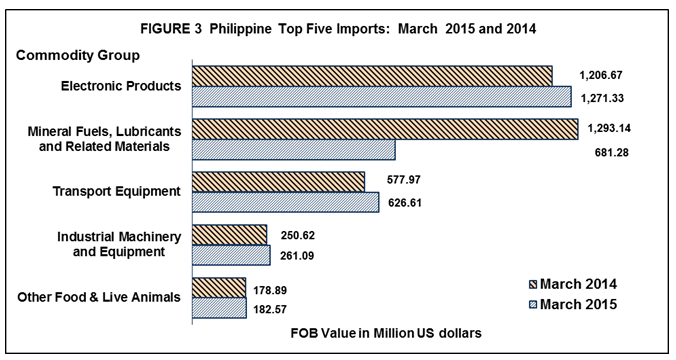
ELECTRONIC PRODUCTS ACCOUNTED FOR 24.9 PERCENT OF IMPORT BILL
Inbound shipments of Electronic Products were the top imported commodity in March 2015, accounting for 24.9 percent of the total import bill with value amounting to $1.271 billion. It expanded by 5.4 percent over last year's figure of $1.207 billion. Among the major groups of electronic products, Components/Devices (Semiconductors), had the biggest share of 18.4 percent, and grew by 1.2 percent, that is, $939.41 million in March 2015 compared from $928.42 million in March 2014.
Imports of Mineral Fuels, Lubricants and Related Materials ranked second with 13.3 percent share and reported value of $681.28 million in March 2015. It went down by 47.3 percent from $1.293 billion in March 2014.
Transport Equipment placed third with 12.3 percent share to total imports valued at $626.61 million compared from previous year’s level of $577.97 million. It accelerated by 8.4 percent from March 2014 figure.
Industrial Machinery and Equipment, contributing 5.1 percent to the total import bill was the country’s fourth top import for the month amounting to $261.09 million. It went up by 4.2 percent compared to last year’s value of $250.62 million.
Fifth in rank and with 3.6 percent share to the total imports, Other Food and Live Animals recorded $182.57 million worth of imports. It registered a 2.1 percent increase from its year ago level of $178.89 million.
Rounding up the list of the top ten imports for March 2015 were: Cereals and Cereal Preparations valued at $180.63 million; Plastics in Primary and Non-Primary Forms, $156.21 million; Feeding Stuff For Animals (Not Including Unmilled Cereals), $123.55 million; Medicinal and Pharmaceutical Products amounting to $121.77 million; and Organic and Inorganic Chemicals, $121.66 million.
Aggregate payment for the country’s top ten imports for March 2015 reached $3.727 billion or 72.9 percent of the total import bill.
ABOUT 40.9 PERCENT OF THE TOTAL IMPORTS WERE RAW MATERIALS AND INTERMEDIATE GOODS
Payments for purchases of Raw Materials and Intermediate Goods in March 2015 were valued at $2.089 billion and accounted for 40.9 percent of the total imports. It decreased by 1.1 percent over last year's figure of $2.113 billion. Semi-Processed Raw Materials had the biggest share of 36.2 percent valued at $1.853 billion and went down by 6.2 percent compared to $1.975 billion value in March 2014.
Payments for inward shipments of Capital Goods accounted for 30.0 percent of the total imports. It rose by 16.6 percent to $1.536 billion in March 2015 from $1.317 billion in March 2015.
Purchases of Consumer Goods recorded 14.7 percent share with a total import bill valued at $752.75 million in March 2015. It increased by 2.8 percent from $732.03 million registered in March 2014.
Mineral Fuels, Lubricants and Related Materials with 13.3 percent share to total imports, decreased by 47.3 percent from $1.293 billion in March 2014 to $681.28 million in March 2015. Other mineral fuel and lubricants such as gas oils, regular and premium unleaded motor spirit and aviation spirit contributed the biggest share of imports in this commodity group.
Special Transactions went up by 75.1 percent to $53.92 million in March 2015 from $30.80 million recorded in March 2015.

IMPORTS FROM PEOPLE’S REPUBLIC OF CHINA ACCOUNTED FOR 12.0 PERCENT
People’s Republic of China remained as the country’s biggest source of imports with 12.0 percent share in March 2015. Payments were recorded at $614.70 million, a decrease of 27.2 percent from $844.11 million in March 2014. Revenue from the country’s exports to China, on the other hand, reached $583.52 million, generating a total trade value of $1.198 billion and $31.18 million trade deficit.
United States of America (USA) including Alaska and Hawaii was the second biggest source of imports for March 2015 with 10.7 percent share to the total import bill amounting to $547.34 million which increased by 30.8 percent from $418.61 million in March 2014. Exports to USA amounted to $879.54 million, yielding a two-way trade value of $1.427 billion and a trade surplus of $332.20 million.
Japan including Okinawa came third, contributing 8.7 percent to the total import bill in March 2015, valued at $445.20 million. It increased by 10.5 percent from its March 2014 value of $402.99 million. Export receipts from Japan in March 2015 reached $1.118 billion yielding a total trade value of $1.563 billion and a trade surplus of $672.77 million.
Republic of Korea ranked fourth, accounting for 7.7 percent share of the total import bill in March 2015 with a negative growth of 39.9 percent from $653.10 million in March 2014 to $392.78 million in March 2015. Exports to this country amounted to $191.91 million resulting to a total trade value of $584.69 million and a trade deficit of $200.87 million.
Fifth in rank was Singapore accounting for 7.1 percent share of the total import bill worth $361.69 million in March 2015, a decrease by 16.9 percent from $435.26 million in March 2014. Exports to Singapore amounted to $312.88 million resulting to a total trade value of $674.57 million and a trade deficit of $48.81 million.
Other major sources of imports for the month of March 2015 were: Taiwan, $340.03 million; Germany, $308.04 million; Thailand, $296.41 million; Indonesia, $250.85 million; and Malaysia (includes Sabah and Sarawak), $244.63 million.
Aggregate payments for imports from the top ten sources for March 2015 amounted to $3.802 billion or 74.4 percent of the total.

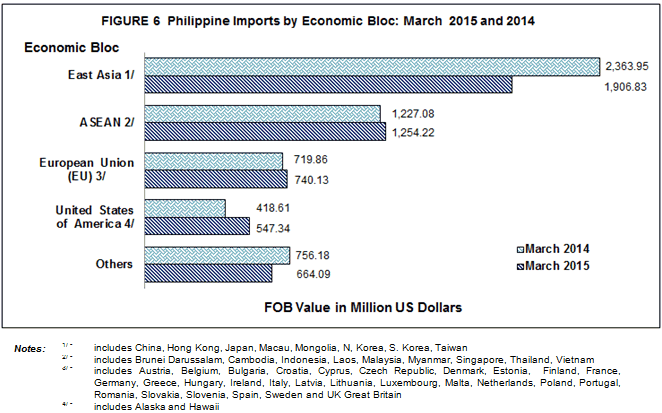
IMPORTS FROM COUNTRIES IN EAST ASIA ACCOUNTED FOR 37.3 PERCENT
By economic bloc, East Asia (China, Hong Kong, Japan, Macau, Mongolia, North Korea, South Korea and Taiwan) was the biggest source of the country’s imports in March 2015 as it accounted for 37.3 percent of the total imports valued at $1.907 billion. It decreased by 19.3 percent from $2.364 billion in March 2014. Total exports to countries of East Asia amounted to $2.586 billion resulting to a total trade of $4.493 billion and a trade surplus of $679.15 billion.
Commodities imported from ASEAN member countries were valued at $1.254 billion, contributing 24.5 percent share and which increased by 2.2 percent from $1.227 billion recorded in March 2014. Proceeds from exports to ASEAN member countries were worth $703.93 million, resulting to a total trade of $1.958 billion and a trade deficit of $550.30 million.
Imports from European Union were valued at $740.13 million. It escalated by 2.8 percent compared to a year ago value of $719.86 million. Exports to member countries of European Union were worth $695.47 million, resulting to a total trade of $1.436 billion and a trade deficit of $44.65 million.
Technical Notes:
- Adjustments on electronic import statistics are based on the transactions that pass through the Electronic to Mobile (e2m) of the Bureau of Customs (BOC).
- Starting with the 2007 Press Release, analysis and tables are based on the 2004 Philippine Standard Commodity Classification (PSCC) groupings. This is in compliance with NSCB Resolution No. 03, Series of 2005 entitled “Approving and Adopting the 2004 Philippine Standard Commodity Classification” by all concerned government agencies and instrumentalities.
(Sgd.) LISA GRACE S. BERSALES, Ph. D.
National Statistician