
Starting with April 2017 report for exports and import statistics, the Press Releases (PR) will be integrated into one (PR).
EXTERNAL TRADE PERFORMANCE
MARCH 2017
(Preliminary)
|
|
March
|
||
|---|---|---|---|
|
|
2017 p |
2016 r |
|
|
TOTAL IMPORTS FOB Value in Million US Dollars Year-on-Year Growth (Percent) Electronic Products FOB Value in Million US Dollars Year-on-Year Growth (Percent) |
7,881.51 24.0
2,007.67 13.8 |
6,357.92 11.7
1,764.16 34.9 |
|
|
Top 10 Philippine Imports from All Countries: March 2017 p
(Year-on-Year Growth in Percent)
|
|||
|---|---|---|---|
Gainers |
Loser |
||
|
Iron and Steel
|
75.9 |
Other Food and Live Animals
|
-13.9 |
|
Cereals and Cereal Preparations
|
63.9 |
|
|
|
Mineral Fuels, Lubricants and Related Materials
|
48.7 |
|
|
|
Miscellaneous Manufactured Articles
|
31.2 | ||
|
Industrial Machinery and Equipment |
25.6 |
|
|
|
Plastics in Primary and Non-Primary Forms
|
25.3 | ||
|
Transport Equipment
|
24.3 | ||
|
Telecommunication Equipment and Electrical Machinery
|
20.3 | ||
|
Electronic Products
|
13.8 | ||
p-preliminary, r-revised

IMPORTS INCREASE BY 24.0 PERCENT IN MARCH 2017
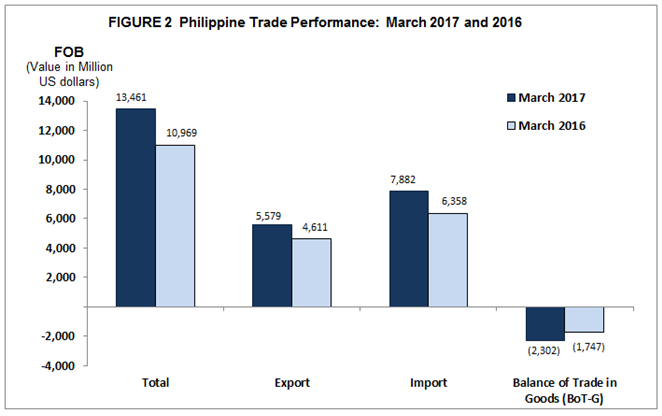
The total imported goods by the country for the month of March 2017 amounted to $7.882 billion, an increase of 24.0 percent from $6.358 billion recorded during the same period a year ago. The increase was due to the positive performance of nine out of the top ten major imported commodities for the month led by iron and steel (75.9%). The other eight positive performers were: cereals and cereal preparations (63.9%); mineral fuels, lubricants and related materials (48.7%); miscellaneous manufactured articles (31.2%); industrial machinery and equipment (25.6%); plastics in primary and non-primary forms (25.3%); transport equipment (24.3%); telecommunication equipment and electrical machinery (20.3%); and electronic products (13.8%). (Table 3)
The balance of trade in goods (BOT-G) for the Philippines in March 2017, however, registered a deficit of $2.302 billion, higher than the $1.747 billion trade deficit in the same month last year. (Table 1)
ELECTRONIC PRODUCTS ACCOUNT FOR 25.5 PERCENT OF TOTAL IMPORT BILL
Total payment for the country’s top ten imports for March 2017 reached $5.760 billion or 73.1 percent of the total import bill. (Table 3)
Inbound shipments of Electronic Products in March 2017 accounted for 25.5 percent of the total import bill with value amounting to $2.008 billion. It increased by 13.8 percent over the last year's figure of $1.764 billion. Components/Devices (Semiconductors), had the biggest share of 17.7 percent among electronic products, increasing by 26.8 percent to $1.397 billion in March 2017 from $1.102 billion in March 2016.
Minerals Fuels, Lubricants and Related Materials placed second with 11.2 percent share to total imports valued at $882.77 million. This registered an increase of 48.7 percent from its previous year’s level of $593.50 million.
Transport Equipment, contributing 10.9 percent to the total import bill was the country’s third top import for the month amounting to $862.06 million. It went up by 24.3 percent compared to last year’s value of $693.36 million.
Imports of Industrial Machinery and Equipment ranked fourth with 7.2 percent share and reported value of $568.53 million in March 2017. It grew by 25.6 percent from $452.80 million in March 2016.
Iron and Steel ranked fifth, with 4.8 percent share to the total imports which was valued at $374.85 million in March 2017. It registered a 75.9 percent increase from its year ago level of $213.05 million.
Rounding up the list of the top ten imports for March 2017 were:
- Other Food and Live Animals valued at $256.34 million
- Miscellaneous Manufactured Articles, $212.51 million.
- Plastics in Primary and Non-Primary Forms, $211.56 million
- Telecommunication Equipment and Electrical Machinery, $196.42 million
- Cereals and Cereal Preparations, $187.36 million

PURCHASES OF RAW MATERIALS AND INTERMEDIATE GOODS ACCOUNT FOR 37.9 PERCENT OF THE TOTAL IMPORTS
By major type of goods, payments for inward shipments of Raw Materials and Intermediate Goods accounted for 37.9 percent of the total imports. It increased by 26.4 percent to $2.984 billion in March 2017 from $2.361 billion in March 2016. Semi-Processed Raw Materials, having the biggest share of this commodity group at 34.7 percent, was $2.732 billion. It went up by 23.9 percent compared to $2.206 billion in March 2016. (Table 5)
Total importation of Capital Goods in March 2017 were valued at $2.661 billion, accounting for 33.8 percent share of the total imports. It increased by 24.9 percent over last year's figure of $2.130 billion.
Purchases of Consumer Goods recorded 16.8 percent share with a total import bill valued at $1.322 billion in March 2017. It recorded a positive growth of 6.6 percent from $1.240 billion registered in March 2016.
Mineral Fuels, Lubricants and Related Materials with 11.2 percent share to total imports, increased by 48.7 percent to $882.77 million in March 2017 from $593.50 million in March 2016. Other mineral fuel and lubricants such as gas oils, regular and premium unleaded motor spirit and aviation spirit, contributed the biggest share of imports for this commodity group at 5.2 percent and valued $409.06 million. (Table 5)
Furthermore, imports of Special Transactions went down by 4.7 percent from $33.59 million recorded in March 2016 to $31.99 million in March 2017.

IMPORTS FROM PEOPLE’S REPUBLIC OF CHINA ACCOUNT FOR 17.5 PERCENT
Aggregate payments from the top ten imports sources for March 2017 amounted to $6.260 billion or 79.4 percent of the total.
People’s Republic of China remained as the country’s biggest source of imports at 17.5 percent share in March 2017. Payments were recorded at $1.378 billion, an increase of 32.5 percent from $1.040 billion in March 2016. Revenue from the country’s exports to People’s Republic of China, on the other hand, reached $635.27 million, generating a total trade value of $2.013 billion and $742.35 million trade deficit.
Japan including Okinawa came second, contributing 13.5 percent or $1.064 billion to the total import bill in March 2017. It grew by 39.2 percent from its March 2016 value of $764.72 million. Export receipts from Japan in March 2017 reached $762.43 million yielding a total trade value of $1.827 billion and an unfavourable balance of trade of $301.79 million.
Republic of Korea, was the third biggest source of imports for March 2017 with 8.7 percent share to the total import bill amounting to $684.30 million, an increase of 53.0 percent from $447.16 million in March 2016. Exports to Korea amounted to $202.45 million, yielding a two-way trade value of $886.74 million and a trade deficit of $481.85 million.
United States of America (USA), including Alaska and Hawaii placed fourth, accounting for 8.2 percent share of the total import worth $648.93 million in March 2017. It went up by 13.0 percent from $574.34 million in March 2016. Exports to USA amounted to $809.93 million resulting to a total trade value of
$1.459 billion and a trade surplus of $160.99 million.
Thailand ranked fifth, accounting for 7.4 percent share of the total import bill in March 2017, recorded a negative growth of 6.4 percent from $620.02 million in March 2016 to $580.12 million in March 2017. Exports to this country amounted to
$217.40 million resulting to a total trade value of $797.52 million and a trade deficit of $362.71 million.
Other major sources of imports for the month of March 2017 were: Singapore, $496.98 million; Indonesia, $461.70 million; Taiwan, $426.41 million; Malaysia (includes Sabah and Sarawak), $291.88 million; and Hong Kong, $227.62 million.

IMPORTS FROM COUNTRIES IN EAST ASIA ACCOUNT FOR 48.0 PERCENT
By economic bloc, East Asia (China, Hong Kong, Japan, Macau, Mongolia, North Korea, South Korea and Taiwan) was the biggest source of the country’s imports in March 2017 accounting for 48.0 percent of the total imports valued at $3.781 billion. It increased by 33.7 percent from $2.827 billion in March 2016. Total exports to countries of East Asia amounted to $2.587 billion resulting to a total trade of $6.368 billion and a trade deficit of $1.193 billion.
Commodities imported from ASEAN member countries were valued at $2.066 billion, contributing 26.2 percent share to total and registered an increase of 15.0 percent from $1.797 billion recorded in March 2016. Proceeds from exports to ASEAN member countries were worth $833.16 million, resulting to a total trade of $2.900 billion and a trade deficit of $1.233 billion.
Imports from European Union were valued at $516.71 million. It rose by 9.8 percent compared to a year ago value of $470.80 million. Exports to member countries of European Union were worth $901.24 million, resulting to a total trade of $1.418 billion and a trade surplus of $384.52 million.

Technical Notes
Import trade statistics are compiled by the Philippine Statistics Authority (PSA) from copies of import documents submitted to the Bureau of Customs (BOC) by importers or their authorized representatives as required by law. Following are the source documents for imports:
- Import Entry and Internal Revenue Declaration (BOC IEIRD Form 236)
- Informal Import Declaration and Entry (BOC Form 177)
- PEZA Warehousing Entry (BOC Form 242 CEWE)
Moreover, an electronic copy of the IEIRD, or called Single Administrative Document (SAD), is utilized to capture the monthly import figures. SAD-IEIRD is an on-line submission of import documents either by brokers or companies. These are transactions that pass through the Automated Cargo Operating System (ACOS) or now called the e2m (electronic to mobile) customs system; a system implemented through the BOC e-Customs Project. The output of this system is provided by BOC to PSA on a monthly basis through email.
All documents (hard copies and e-files) received before the cut-off date which is every 10th day of the month are compiled, processed and generated in a monthly statistical tables for the preparation of Press Release. All documents received after the cut-off date, however, are processed and included in the generation of the revised statistical tables. Processing includes coding, editing, review and validation. Revised statistical tables are made available 10 to 15 working days after the press release date.
Press Releases (PR) for Imports are disseminated at the same date of the PR for Export. These are released every 10th day of each month.
The 2004 Philippine Standard Commodity Classification (PSCC) is used to classify the commodities at the 10-Digit level for statistical purposes.
Detailed data on international merchandise trade statistics are available at Philippine Statistics Authority, Economic Sector Statistics Service, Trade Statistics Division (Telephone Number: 376-19-75).
| Attachment | Size |
|---|---|
|
|
297.04 KB |
|
|
137 KB |