
EXTERNAL TRADE PERFORMANCE
MAY 2013
(Preliminary)
p-preliminary
r-revised

MAY 2013 TOTAL TRADE STANDS AT $10.151 BILLION
Total external trade in goods for May 2013 reached $10.151 billion, representing a 1.6 percent decline from $10.317 billion recorded during the same month in 2012. This was due to the 2.4 percent downward trend of total imports from $5.386 billion to $5.258 billion in May 2013. Similarly, exports showed a decreased of 0.8 percent from $4.932 billion to $4.893 billion in the same month a year ago. Thus, the balance of trade in goods (BOT-G) for the Philippines in May 2013 registered a deficit of $364 million from $454 million deficit in the same period last year.

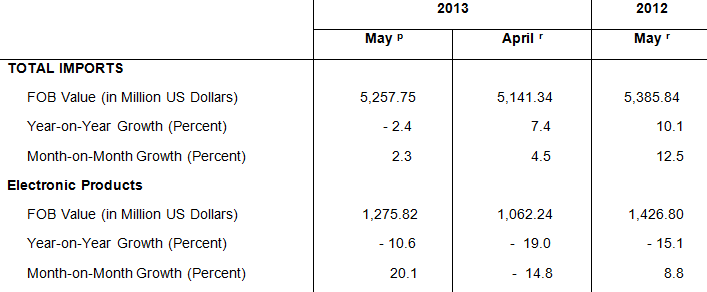
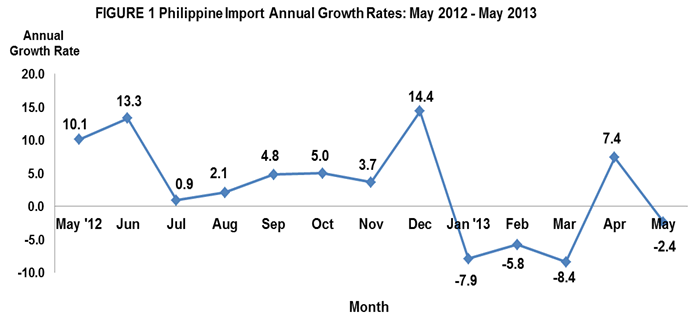
MAY 2013 IMPORTS DOWN BY 2.4 PERCENT
The country’s total merchandise imports for this month went down by 2.4 percent from $5.386 billion in May 2012 to $5.258 billion in May 2013. However, it increased by 2.3 percent from $5.141 billion compared to previous month’s level. The negative growth was brought about by six out of 10 major commodity groups whose year-on-year change was negative. These were as follows: cereals and cereal preparations; transport equipment; electronic products; mineral fuels, lubricants and related materials; plastics in primary and non-primary forms; and organic and inorganic chemicals. Similarly, aggregate imports for the first five months of 2013 amounting to $24.755 billion showed a 3.6 percent decline compared with $25.683 billion in the same five months of last year.
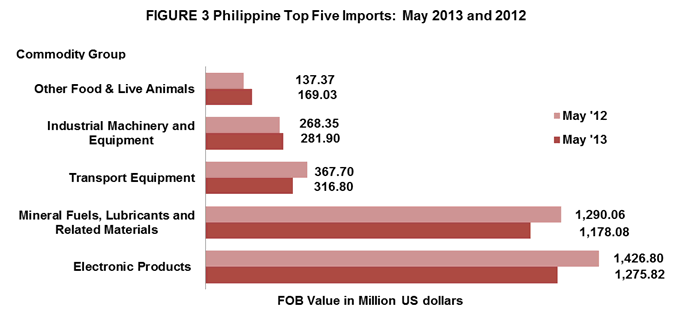
ELECTRONIC PRODUCTS ACCOUNT FOR 24.3 PERCENT OF IMPORT BILL
Accounting for 24.3 percent of the aggregate import bill, Electronic Products was the top imported commodity in May 2013 with payments amounting to $1.276 billion. It fell by 10.6 percent over last year's figure of $1.427 billion. On a monthly basis, it grew by 20.1 percent from $1.062 billion recorded in April 2013. Volume of shipment of this product also went up by 1.9 percent compared to May 2012 and a 13.9 percent increase compared to April 2013. Among the major groups of electronic products, Components/Devices (Semiconductors), having the biggest share of 19.0 percent, decreased by 8.2 percent from $1.088 billion in same month a year ago to $999.39 million in May 2013.
Imports of Mineral Fuels, Lubricants and Related Materials ranked second with 22.4 percent share and posted a negative annual growth rate of 8.7 percent from reported value of $1.290 billion in May 2012 to $1.178 billion in May 2013. Shipment of this product in terms of volume grew by 19.7 percent compared to its recorded volume in May 2012.
Transport Equipment was the PH’s third top import for the month with 6.0 percent share to total imports valued at $316.80 million in May 2013. This figure was 13.8 percent lower than the previous year’s level of $367.70 million. Similarly, compared to previous month, import dropped by 46.3 percent from $589.63 million in April 2013.
Industrial Machinery and Equipment, contributing 5.4 percent to the total import bill was the PH’s fourth top import for the month amounting to $281.90 million. It rose by 5.1 percent compared to last year’s value of $268.35 million. Likewise, the volume of shipment of this product accelerated by 15.1 percent compared with same period last year.
Fifth in rank and with 3.2 percent share to the total imports, Other Food and Live Animals recorded $169.03 million worth of imports, higher by 23.0 percent from its year ago level of $137.37 million. Inward shipments in terms of gross kilos registered a positive year-on-year change of 29.2 percent.
Rounding up the list of the top ten imports for May 2013 were Metalliferous Ores and Metal Scrap valued at $142.55 million, registering the highest annual growth rate of 7,022.6 percent among the top ten imports; Iron and Steel amounting to $140.32 million; Plastics in Primary and Non - Primary Forms, $132.79 million; Organic and Inorganic Chemicals, $130.01 million; and Cereals and Cereal Preparations, $118.89 million.
Aggregate payment for the country’s top ten imports for May 2013 reached $3.886 billion or 73.9 percent of the total import bill.
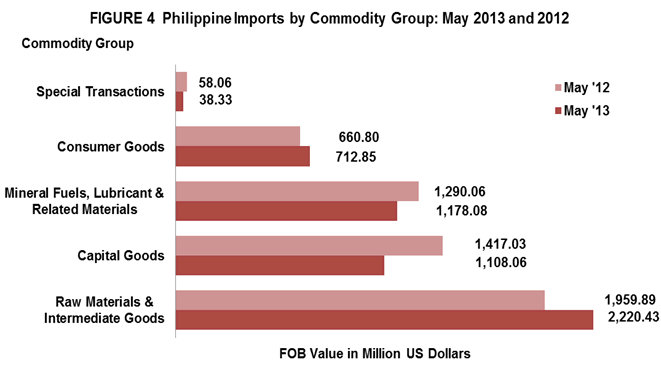
RAW MATERIALS AND INTERMEDIATE GOODS ACCOUNT FOR 42.2 PERCENT OF THE TOTAL IMPORTS
Accounting for 42.2 percent of the total imports, payments in May 2013 for Raw Materials and Intermediate Goods amounted to $2.220 billion or a 13.3 percent increment over last year's figure of $1.960 billion. Compared to the previous month’s level, purchases also went up by 27.5 percent from $1.741 billion. Semi-Processed Raw Materials had the biggest share of 36.7 percent and valued at $1.928 billion. However, volume of inward shipments of raw materials and intermediate goods dropped by 7.7 percent compared with same month a year ago.
Capital Goods, which comprised 21.1 percent of the total imports, dropped by 21.8 percent from $1.417 billion in May 2012 to $1.108 billion in May 2013. However, volume of inward shipments for this product was up by 10.2 percent compared to same month a year ago.
Mineral Fuels, Lubricants and Related Materials with 22.4 percent share to total imports contracted by 8.7 percent from $1.290 billion to $1.178 billion in May 2013. On the other hand, volume of shipment of this product grew by 19.7 percent.
Purchases of Consumer Goods amounted to $712.85 million or a 7.9 percent growth from $660.80 million in May 2012 while Special Transactions went down by 34.0 percent from $58.06 million to $38.33 million in May 2013. However, in terms of volume of shipments, imports of consumer goods and special transactions registered a positive growth of 7.2 percent and 5.2 percent respectively, compared with same month last year.
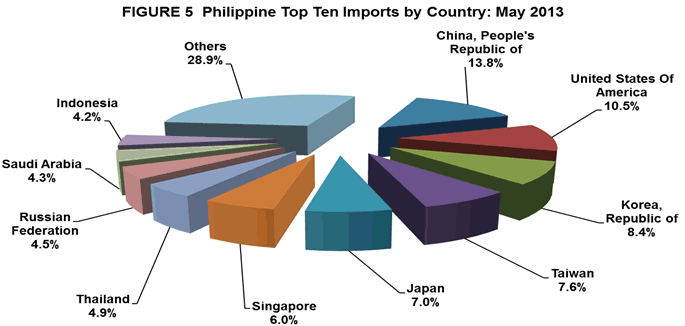
IMPORTS FROM PEOPLE’S REPUBLIC OF CHINA ACCOUNT FOR 13.8 PERCENT
People’s Republic of China was the country’s biggest source of imports for May 2013 with 13.8 percent share of the total import bill, higher by 21.8 percent to $727.45 million from $597.27 million in May 2012. The increase was attributed to the purchases of mineral fuels, lubricants and related materials, electronic products and plastics in primary and non-primary forms. Exports to China amounted to $571.99 million, yielding a two-way trade value of $1.299 billion and a trade deficit for PH of $155.46 million.
United States of America (USA) including Alaska and Hawaii was the second biggest source of imports with 10.5 percent share. Payments were recorded at $553.39 million, a decrease of 15.1 percent from $652.18 million in May 2012. Commodities imported from USA were mostly electronic products, cereals and cereal preparations, and metalliferous ores and metal scraps. Revenue from PH’s exports to USA, on the other hand, reached $607.06 million, generating a total trade value of $1.160 billion and $53.67 million trade surplus for the Philippines.
Republic of Korea came third, accounting for about 8.4 percent share of the total import bill in May 2013 with a negative growth of 22.2 percent from $565.83 million to $440.39 million. Mineral fuels, lubricants and related materials were the recorded imported goods from Korea. Exports to Korea amounted to $375.89 million resulting to a total trade value of $816.28 million and a trade deficit of $64.49 million.
Taiwan settled fourth accounting for 7.6 percent share of the total import bill in May 2013 or a decrease of 16.1 percent from $476.40 million to $399.48 million in May 2013. Commodities purchased from Taiwan in April 2013 were mineral fuels, lubricants and related materials and components/devices (semiconductors). Exports to Taiwan amounted to $127.93 million resulting to a total trade value of $527.42 million and a trade deficit of $271.55 million.
Fifth in rank was Japan including Okinawa, representing a 7.0 percent of the total import bill in May 2013 amounting to $365.61 million. Electronic products; iron and steel, and transport equipment were the imported goods from Japan. Meanwhile, export receipts from Japan in May 2013 reached $981.79 million yielding a total trade value of $1.347 billion and a trade surplus of $616.18 million.
Other major sources of imports for the month of May 2013 were: Singapore, $313.81 million; Thailand $258.46 million; Russian Federation, $236.16 million; Saudi Arabia, $223.80 million; and Indonesia, $221.47 million.
Payments for imports from the top ten sources for May 2013 amounted to $3.740 billion or 71.1 percent of the total.
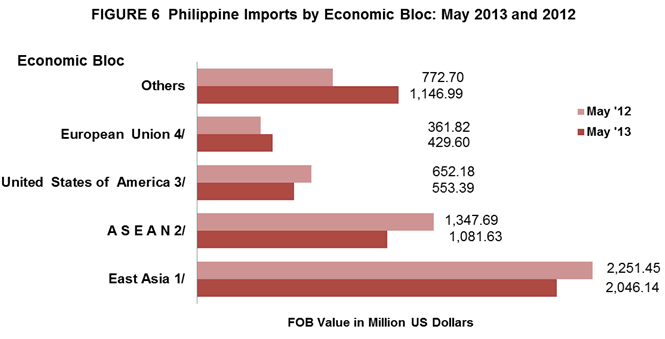
IMPORTS FROM EAST ASIA WORTH $2.046 BILLION
Philippines total imports in May 2013 with East Asia (China, Hong Kong, Japan, Macau, Mongolia, North Korea, South Korea and Taiwan) accounted for 38.9 percent of the county’s total imports with total payments of $2.046 billion or a negative annual growth of 9.1 percent from May 2012 level of $2.251 billion. Total exports to member-countries of East Asia were valued at $2.421 billion resulting to a total trade of $4.467 billion and a balance of trade in goods (BOT-G) surplus of $374.84 million.
May 2013 imports from ASEAN member-countries registered at $1.082 billion, contributed 20.6 percent share, lower by 19.7 percent from $1.348 billion registered in May 2012. Exports to ASEAN member-countries worth $1.055 billion resulted to a total trade of $2.136 billion and a trade deficit of $26.83 million.
Imports from European Union were valued at $429.60 million. It expanded by 18.7 percent compared to a year ago recorded value of $361.82 million while exports to member-countries of European Union were worth $519.95 million. This aggregated to total trade of $949.55 million and a trade surplus of $90.35 million.
Notes:
1/ - includes China, Hong Kong, Japan, Macau, Mongolia, N, Korea, S. Korea, Taiwan
2/ - includes Brunei Darussalam, Cambodia, Indonesia, Laos, Malaysia, Myanmar, Singapore, Thailand, Vietnam
3/ - includes Alaska and Hawaii
4/ - includes Austria, Belgium, Bulgaria, Cyprus, Czech Republic, Denmark, Estonia, Finland, France, Germany,
Greece, Hungary, Ireland, Italy, Latvia, Lithuania, Luxembourg, Malta, Netherlands, Poland, Portugal,
Romania, Slovakia, Slovenia, Spain, Sweden and UK Great Britain
Technical Notes:
- Adjustments on electronic import statistics are based on the transactions that pass through the Electronic to Mobile (e2m) of the Bureau of Customs (BOC).
- Starting with the 2007 Press Release, analysis and tables are based on the 2004 Philippine Standard Commodity Classification (PSCC) groupings. This is in compliance with NSCB Resolution No. 03, Series of 2005 entitled “Approving and Adopting the 2004 Philippine Standard Commodity Classification” by all concerned government agencies and instrumentalities.
CARMELITA N. ERICTA
Administrator
Source: Foreign Trade Statistics Section
Industry and Trade Statistics Department
National Statistics Office
Manila, Philippines