
EXTERNAL TRADE PERFORMANCE
MAY 2014
(Preliminary)
|
|
May
|
||
|---|---|---|---|
|
|
2014 p |
2013 r |
|
|
TOTAL IMPORTS FOB Value in Million US Dollars Year-on-Year Growth (Percent) Electronic Products FOB Value in Million US Dollars Year-on-Year Growth (Percent) |
4,765.29 - 9.6
1,264.89 - 1.2 |
5,272.10 - 2.1
1,279.98 - 11.1 |
|
|
Top 10 Philippine Imports from All Countries: May 2014 p
(Year-on-Year Growth in Percent)
|
|||
|---|---|---|---|
Gainers |
Losers |
||
|
Transport Equipment
|
33.6 |
Mineral Fuels, Lubricants and Related Materials
|
-43.6 |
|
Plastics in Primary and Non-Primary Forms
|
18.0 |
Cereals and Cereal Preparations
|
-12.7 |
|
Telecommunication Equipment and Electrical Machinery
|
17.2 |
Industrial Machinery and Equipment
|
-9.2 |
|
Other Food and Live Animals
|
12.8 |
Electronic Products
|
-1.2 |
|
Miscellaneous Manufactured Articles
|
1.3 |
|
|
|
Iron and Steel
|
0.7 |
|
|
p-preliminary, r-revised
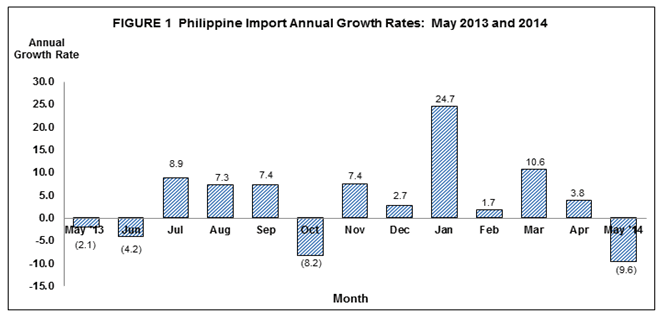
MAY 2014 IMPORTS DECLINE BY 9.6 PERCENT
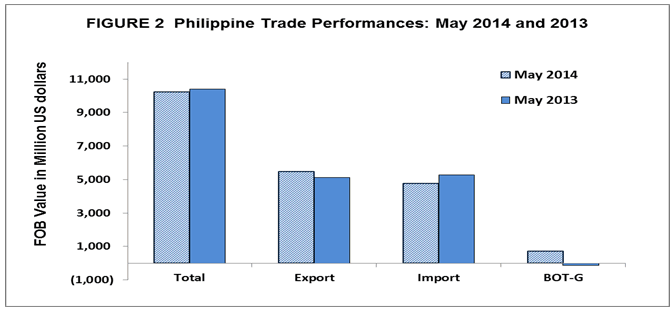
In May of 2014, Philippine’s total external trade in goods amounted to $4.765 billion, a 9.6 percent negative growth from $5.272 billion in May of 2013. The decrease in total imports for this period was due to the negative performance of four out of the top ten major commodities for the month. These were: mineral fuels, lubricants and related materials; cereals and cereal preparations; industrial machinery and equipment; and electronic products. Of the major commodities that caused the decline in the country’s imports, inward shipments of Mineral fuels, lubricants and related materials showed a remarkable 43.6 percent decrease (an equivalent of $513.98 million) in the same month of previous year’s level.
The cumulative imports for the first five months of 2014 amounted to $26.336 billion and showed a 5.9 percent increase compared with $24.862 billion in the same period of last year.
The balance of trade in goods (BOT-G) for the Philippines in May 2014 registered a surplus of $718 million compared to the $141 million deficit in the same period last year.
ELECTRONIC PRODUCTS ACCOUNTS FOR 26.5 PERCENT OF IMPORT BILL
Imports of Electronic Products were the top imported commodities in May 2014, with 26.5 percent share and reported value of $1.265 billion in May 2014. It decelerated by 1.2 percent from $1.280 billion in May 2013. By major groups of electronic products, Components/Devices (Semiconductors), had the biggest share of 21.6 percent among electronic products, increased by 2.6 percent to $1.028 billion in May 2014 compared to $1.001 billion in May 2013.
Inward shipments of Mineral Fuels, Lubricants and Related Materials ranked second, accounting for 13.9 percent of the total import bill and value amounting to $664.05 million. It decreased by 43.6 percent over last year's figure of $1.178 billion.
Transport Equipment placed third with 8.9 percent share to total imports valued at $423.24 million. It recorded the highest increase among the top ten imports by 33.6 percent from its year ago level of $316.85 million.
Industrial Machinery and Equipment, contributing 5.4 percent to the total import bill was the country’s fourth top import for the month amounting to $256.50 million. It went down by 9.2 percent compared to last year’s value of $282.58 million.
Fifth in rank were Other Food and Live Animals, with a 3.8 percent share to the total imports which valued at $182.58 million. It accelerated by 12.8 percent from previous year’s level of $161.93 million.
Rounding up the list of the top ten imports for May 2014 were: Plastics in Primary and Non-Primary Forms valued at $155.71 million; Miscellaneous Manufactured Articles, $142.53 million; Iron and Steel, $141.24 million; Telecommunication Equipment and Electrical Machinery amounting to $112.72 million; and Cereals and Cereal Preparations, $103.98 million.
Total purchases for the country’s top ten imports for May 2014 reached $3.447 billion or 72.3 percent of the total import bill.

ABOUT HALF (49.8%) OF THE TOTAL IMPORTS ARE RAW MATERIALS AND INTERMEDIATE GOODS
Total payments for inbound shipments of Raw Materials and Intermediate Goods in May 2014 was valued at $2.374 billion and accounted for 49.8 percent of the total imports. It increased by 6.3 percent over last year's figure of $2.234 billion. Semi-Processed Raw Materials had the biggest share of 46.0 percent valued at $2.193 billion.
Purchases for Capital Goods accounted for 20.6 percent of the total imports. It declined by 11.7 percent from $1.109 billion in May 2013 to $979.18 million in May 2014.
Consumer Goods recorded a 15.1 percent share to total import bill valued at $718.73 million in May 2014. It increased by 0.8 percent from $712.88 million registered in May 2013.
Mineral Fuels, Lubricants and Related Materials with 13.9 percent share to total imports, decreased by 43.6 percent from $1.178 billion in May 2013 to $664.05 million in May 2014. Petroleum crude contributed the biggest share of imports in this commodity group by 6.8 percent.
Special Transactions declined by 23.8 percent from $38.30 million to $29.17 million in May 2014.

IMPORTS FROM PEOPLE’S REPUBLIC OF CHINA ACCOUNT FOR 15.2 PERCENT
The main source of imports in May 2014 was from People’s Republic of China, accounting for 15.2 percent of the total overseas purchases. Payments were valued at $724.37 million, decreased by 2.2 percent from $740.91 million in May 2013. Revenue from country’s exports to China reached $958.80 million, generating a total trade value of $1.683 billion and $234.43 million trade surplus.
United States of America (USA) including Alaska and Hawaii ranked second, accounting for 11.0 percent share of the total import bill in May 2014 with a downward performance of 5.0 percent from $553.56 million to $525.70 million in May 2014. Exports to this country amounted to $749.50 million resulting to a total trade value of $1.275 billion and a trade surplus of $223.80 million.
Malaysia came third, contributing 9.8 percent of the total import bill in May 2014, with import value of $467.87 million. Export receipts from Malaysia in May 2014 reached $98.47 million yielding a total trade value of $566.35 million and a trade deficit of $369.40 million.
Japan including Okinawa was the fourth biggest source of imports for May 2014 with 8.7 percent share to the total import bill amounting to $413.77 million and increased by 13.1 percent from $365.73 million in May 2013. Exports to Japan amounted to $1.120 billion, yielding a two-way trade value of $1.533 billion and a trade surplus of $705.95 million.
Fifth in rank was Republic of Korea, accounting for 7.0 percent share of the total import bill valued at $331.25 million, fell by 24.8 percent from $440.43 million compared to same period last year. Exports to Republic of Korea amounted to $187.24 million resulting to a total trade value of $518.49 million and a trade deficit of $144.01 million.
The country’s other major sources of imports for the period were: Singapore, $324.44 million; Indonesia, $231.19 million; Thailand, $207.82 million; Taiwan, $202.80 million; and France, $183.34 million.
Total payments for imports from the top ten sources for May 2014 amounted to $3.613 billion or 75.8 percent of the total.

EAST ASIA ACCOUNTS FOR 38.3 PERCENT OF THE TOTAL IMPORTS
East Asia (China, Hong Kong, Japan, Macau, Mongolia, North Korea, South Korea and Taiwan) was the biggest source of the country’s imports in May 2014 as it accounted for 38.3 percent of the total imports valued at $1.825 billion. It decreased by 11.4 percent from $2.060 billion in May 2013. Total exports to member countries of East Asia amounted to $2.858 billion resulting to a total trade of $4.683 billion and a trade surplus of $1.034 billion.
Merchandise imported from ASEAN member countries were valued at $1.302 billion, contributing 27.3 percent share and increased by 20.3 percent from $1.082 billion recorded in May 2013. Sales from exports to ASEAN member countries were worth $911.95 million, resulting to a total trade of $2.214 billion and a trade deficit of $389.98 million.
Imports from European Union amounted to $526.66 million. It increased by 22.6 percent compared to a year ago value of $429.61 million. Exports to member countries of European Union were worth $601.58 million, resulting to a total trade of $1.128 billion and a trade surplus of $74.93 million.

Technical Note:
Starting with the March 2007 Press Release, analysis and tables are based on the 2004 Philippine Standard Commodity Classification (PSCC) groupings. This is in compliance with NSCB Resolution No. 03, Series of 2005 entitled “Approving and Adopting the 2004 Philippine Standard Commodity Classification” by all concerned government agencies and instrumentalities.
(Sgd) LISA GRACE S. BERSALES, Ph. D.