
EXTERNAL TRADE PERFORMANCE
November 2012
(Preliminary)
p-preliminary
r-revised

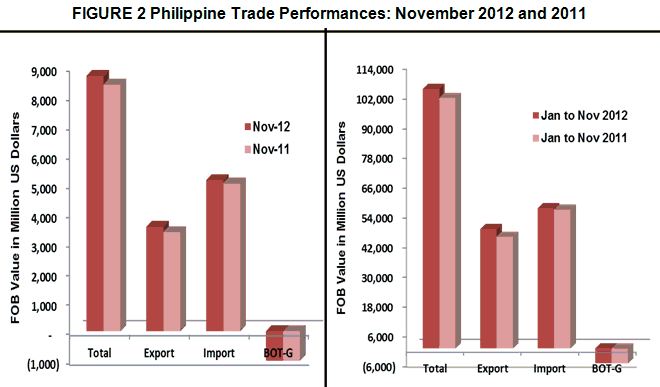
NOVEMBER 2012 TOTAL TRADE STANDS AT $8.685 BILLION
Total external trade in goods for November 2012 reached $8.685 billion, representing a 3.5 percent increase from $8.390 billion recorded during the same month in 2011. The increase can be attributed to the 5.5 percent positive growth of exports to $3.550 billion from $3.366 billion in the same month a year ago. Also, total imports expanded by 2.2 percent to $5.135 billion from $5.024 billion in November 2011. Thus, the balance of trade in goods (BOT-G) for the Philippines in November 2012 registered a deficit of $1.586 billion from $1.658 billion deficit in the same period last year.
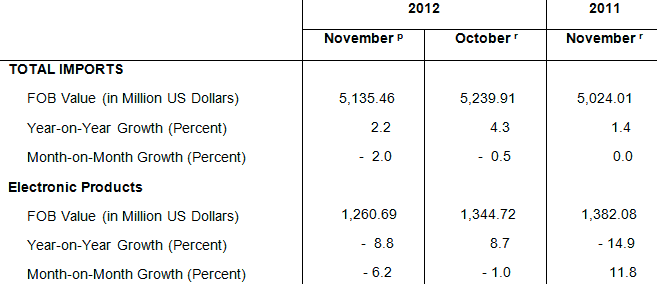
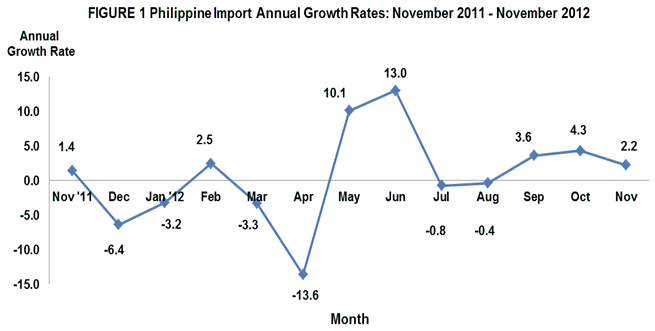
NOVEMBER 2012 IMPORTS GROW BY 2.2 PERCENT
Payments for merchandise imports amounted to $5.135 billion in November 2012, up by 2.2 percent from $5.024 billion in November 2011. The positive performance of imports was due to the increase in inward shipments of major commodities such as transport equipment, miscellaneous manufactured articles, feeding stuff for animals, mineral fuels, lubricants and related materials, and industrial machinery and equipment. Compared to previous month’s level, however, purchases went down by 2.0 percent from $5.240 billion.
For the first eleven months of 2012, aggregate imports went up by 1.0 percent to $56.410 billion from $55.863 billion for the same period in 2011.
ELECTRONIC PRODUCTS ACCOUNT FOR 24.5 PERCENT OF IMPORT BILL
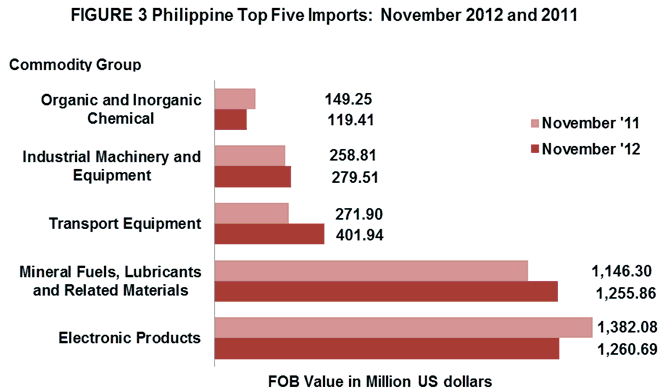
Payments for Electronic Products (including consigned and direct importation using the expanded coverage of electronic products) were down by 8.8 percent from $1.382 billion reported value in November 2011 to $1.261 billion in November 2012. These commodities accounted for 24.5 percent of the total imports for the period in review. Among the major groups of electronic products, Components/Devices (Semiconductors) having the biggest share of 18.5 percent decreased by 11.4 percent from $1.073 billion to $950.37 million. Month-on-month, reported value of semiconductor contracted by 8.1 percent. Similarly, volume of shipments both for electronic products and semiconductors went down by 9.0 percent and 30.2 percent, respectively in November 2012.
Import bill payments for Mineral Fuels, Lubricants and Related Materials ranked second among the top ten imports with 24.5 percent share to total imports registering an annual increase of 9.6 percent to $1.256 billion in November 2012 from $1.146 billion in same month a year ago. The expansion may be attributed to the increase in volume of shipments of this product.
Transport Equipment was the PH’s third top import for the month with 7.8 percent share to total imports valued at $401.94 million from $271.90 million. This recorded the highest growth at 47.8 percent among the top ten imports for November 2012. Similarly, in terms of volume of inward shipments, it expanded by 43.4 percent compared to the recorded volume of inward shipments a year ago.
Industrial Machinery and Equipment contributing 5.4 percent to the total import bill was the fourth top import for the month amounting to $279.51 million. Compared to last year’s level of $258.81 million, it went up by 8.0 percent. Month-on-month, it slightly grew by 0.5 percent compared to recorded value of $278.07 million in October 2012. Similarly, volume purchases went up by 32.7 percent from the same period last year.
Fifth in rank and with 2.3 percent share to the total imports was Organic and Inorganic Chemicals valued at $119.41 million from $149.25 million worth of imports in November 2011. Recorded value dropped by 20.0 percent while volume of shipments grew very minimal.
Rounding up the list of the top ten imports for November 2012 were Feeding Stuff for Animals, $111.05 million; Plastics in Primary and Non-Primary Forms, $108.70 billion; Miscellaneous Manufactured Articles, $103.38 million; Telecommunication Equipment and Electrical Machinery, $95.59 million; and Iron and Steel, $85.31 million.
Aggregate payment for the country’s top ten imports for November 2012 reached $3.821 billion or 74.4 percent of the total import bill.
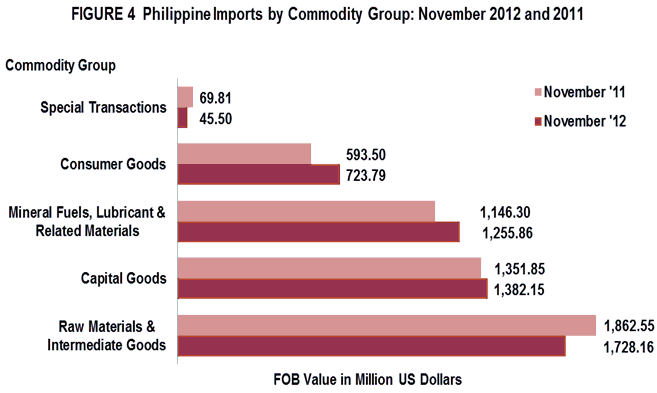
RAW MATERIALS AND INTERMEDIATE GOODS ACCOUNT FOR 33.7 PERCENT OF THE TOTAL IMPORTS
The value of imported Raw Materials and Intermediate Goods comprised 33.7 percent of the total imports in November 2012. Year-on-year change went down by 7.2 percent from $1.863 billion to $1.728 billion. The contraction was brought about by the 26.4 percent decrease in the value of unprocessed raw materials and 4.8 percent decline in value of semi-processed raw materials. However, volume of inward shipments for these products went up by 2.9 percent.
Accounting for 26.9 percent of the total imports, payments for Capital Goods amounted to $1.382 billion or a 2.2 percent increment over last year's figure of $1.352 billion. However, purchases went down by 3.1 percent compared to previous month’s value of $1.426 billion. On the other hand, volume of inward shipment of this product registered an increase of 27.1 percent compared to last year’s recorded volume of purchases.
Purchases of Consumer Goods amounted to $723.79 million or a positive growth of 22.0 percent from $593.50 million in November 2011. The expansion was brought about by the 36.4 percent and 8.8 percent increase in purchases of durable goods and non-durable goods. Similarly, volume of inward shipments also showed a 19.9 percent improvement compared to same month a year ago volume of shipments.
Imports of commodities under Special Transactions valued at $45.50 million dropped by 34.8 percent from $69.81 million recorded in November 2011. However, total volume of inward manifest registered a 15.5 percent growth compared to its year ago volume of importation.
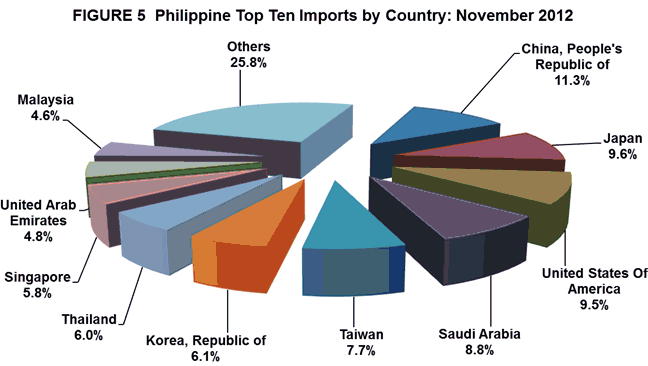
IMPORTS FROM PEOPLE’S REPUBLIC OF CHINA ACCOUNT FOR 11.3 PERCENT
People’s Republic of China was the country’s main source of imported goods in November 2012 with 11.3 percent share. Payments were recorded at $580.78 million, an increase of 4.4 percent from $556.38 million in November 2011. The increase in the inward purchases from People’s Republic of China includes importation of telecommunication equipment and electrical machinery, and power generating and specialized machines. Revenue from PH’s exports to People’s Republic of China, on the other hand, reached $371.66 million, generating a total trade value of $952.44 million and $209.11 million trade deficit for the Philippines.
Following People’s Republic of China as top source of the country’s imports was Japan including Okinawa, with 9.6 percent share to the total import bill amounting to $495.02 million, lower by 21.7 percent from $632.44 million in November 2011. Commodities imported from Japan were telecommunication equipment and electrical machinery, power generating and specialized machines, land transport equipment (excluding passenger cars) and materials and accessories for the manufacture of electrical equipment. Exports to Japan amounted to $738.65 million, yielding a two-way trade value of $1.234 billion and a trade surplus for PH of $243.63 million.
United States of America (USA) including Alaska and Hawaii came in third, accounting for 9.5 percent share of the total import bill in November 2012 with negative growth of 10.6 percent from $544.24 million to $486.41 million. Telecommunication equipment and electrical machinery, materials and accessories for the manufacture of electrical equipment and feeding stuffs for animals were the recorded imported goods from USA. Exports to USA amounted to $458.37 million resulting to a total trade value of $944.78 million and a trade deficit of $28.05 million.
Saudi Arabia ranked fourth among the top sources of imports for the country accounting for 8.8 percent share of the total import bill in November 2012. It increased by 39.0 percent to $452.99 million from $325.89 million. Commodities purchased from Saudi Arabia in November 2012 were mostly mineral fuels and lubricants. On the other hand, exports to Saudi Arabia amounted to $3.20 million resulting to a total trade value of $456.19 million and a trade deficit of $449.80 million.
Fifth in rank was Taiwan, representing 7.7 percent of the total import bill or an increase of 29.0 percent to $395.95 million from $306.98 million in the same month last year. Mineral, fuels and lubricants and components/devices (semiconductors) were among the highest imported goods from Taiwan in November 2012. Exports to Taiwan amounted to $199.36 million resulting to a total trade value of $595.31 million and a trade deficit of $196.59 million.
Other major sources of imports for the month of November 2012 were Republic of Korea, $313.56 million; Thailand, $307.20 million; Singapore, $296.49 million; United Arab Emirates, $244.14 million; and Malaysia, $238.30 million.
Payments for imports from the top ten sources for November 2012 amounted to $3.811 billion or 74.2 percent of the total.
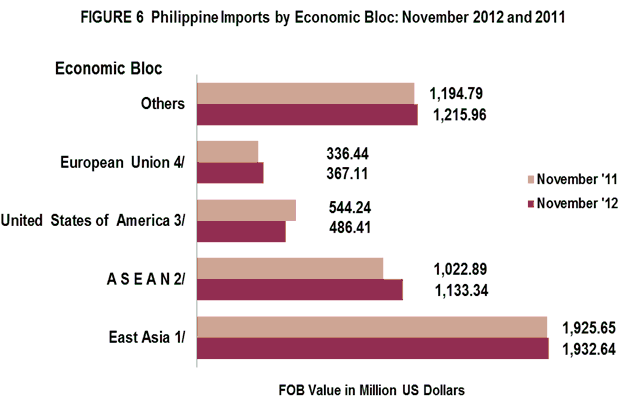
IMPORTS FROM EAST ASIA WORTH $1.933 BILLION
Philippines’ total imports in November 2012 from East Asia accounted for 37.6 percent of the county’s total imports with total payments of $1.933 billion or a positive annual growth of 0.4 percent from November 2011 level of $1.926 billion. Total exports to member-countries of East Asia were valued at $1.854 billion, resulting to a total trade of $3.787 billion and a balance of trade in goods (BOT-G) deficit of $78.68 million.
Imports from ASEAN member-countries recorded 22.1 percent share to total imports. Imports value recorded for November 2012 was $1.133 billion, higher by 10.8 percent from $1.023 billion registered in same month in 2011. On the other hand, exports to ASEAN member-countries worth $598.43 million resulted to a total trade of about $1.732 billion and a trade deficit of $534.91 million.
November 2012 imports from European Union were valued at $367.11 million while exports to member-countries of European Union were worth $411.05 million. These aggregated to a total trade value of $778.15 million and a trade surplus of $43.94 million.
Notes:
1/ - includes China, Hong Kong, Japan, Macau, Mongolia, N, Korea, S. Korea, Taiwan
2/ - includes Brunei Darussalam, Cambodia, Indonesia, Laos, Malaysia, Myanmar, Singapore, Thailand, Vietnam
3/ - includes Alaska and Hawaii
4/ - includes Austria, Belgium, Bulgaria, Cyprus, Czech Republic, Denmark, Estonia, Finland, France, Germany,
Greece, Hungary, Ireland, Italy, Latvia, Lithuania, Luxembourg, Malta, Netherlands, Poland, Portugal,
Romania, Slovakia, Slovenia, Spain, Sweden and UK Great Britain
Technical Notes:
- Adjustments on electronic import statistics are based on the transactions that pass through the Electronic to Mobile (e2m) of the Bureau of Customs (BOC).
- Starting with the 2007 Press Release, analysis and tables are based on the 2004 Philippine Standard Commodity Classification (PSCC) groupings. This is in compliance with NSCB Resolution No. 03, Series of 2005 entitled “Approving and Adopting the 2004 Philippine Standard Commodity Classification” by all concerned government agencies and instrumentalities.
CARMELITA N. ERICTA
Administrator
Source: Foreign Trade Statistics Section
Industry and Trade Statistics Department
National Statistics Office
Manila, Philippines