
EXTERNAL TRADE PERFORMANCE
NOVEMBER 2014
(Preliminary)
|
|
November
|
||
|---|---|---|---|
|
|
2014 p |
2013 r |
|
|
TOTAL IMPORTS FOB Value in Million US Dollars Year-on-Year Growth (Percent) Electronic Products FOB Value in Million US Dollars Year-on-Year Growth (Percent) |
4,989.44 -10.8
1,408.34 21.8 |
5,592.57 7.4
1,156.40 - 8.4 |
|
|
Top 10 Philippine Imports from All Countries: November 2014 p
(Year-on-Year Growth in Percent)
|
|||
|---|---|---|---|
Gainers |
Losers |
||
|
Cereals and Cereal Preparations
|
59.9 |
Transport Equipment
|
-65.2 |
|
Plastics in Primary and Non-Primary Forms
|
58.6 |
Mineral Fuels, Lubricants and Related Materials
|
-23.1 |
|
Feeding Stuff For Animals (Not Including Unmilled Cereals)
|
37.3 |
Industrial Machinery and Equipment
|
-16.7 |
|
Other Food and Live Animals
|
33.5 |
Miscellaneous Manufactured Articles
|
-5.6 |
|
Electronic Products |
21.8 | ||
|
Iron and Steel
|
8.7 | ||
p-preliminary, r-revised
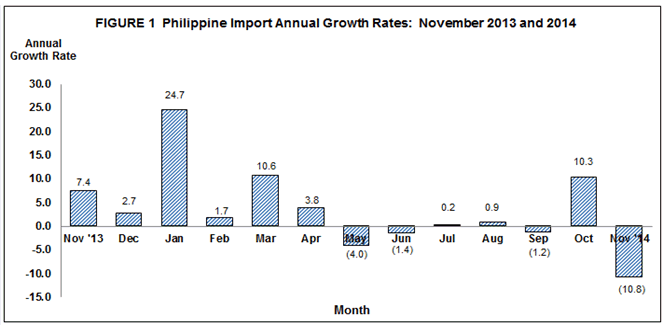
IMPORTS DECLINE BY 10.8 PERCENT IN NOVEMBER 2014
The country’s total imported goods for November 2014 amounted to $4.989 billion, a decrease of 10.8 percent from $5.593 billion recorded during the same period a year ago. The decline in total imports for this period was due to the negative performance of four out of the top ten major commodities for the month. These were: Transport Equipment; Mineral Fuels, Lubricants and Related Materials; Industrial Machinery and Equipment; and Miscellaneous Manufactured Articles. Of the major commodities that caused the decline in the country’s imports, inward shipments of Transport Equipment showed a remarkable 65.2 percent decrease (an equivalent of $652.36 million) in the same month of previous year’s level.
Cumulative imports for the eleven month period of 2014 amounted to $58.549 billion and showed a 2.8 percent increase compared with $56.965 billion in the same period of last year.
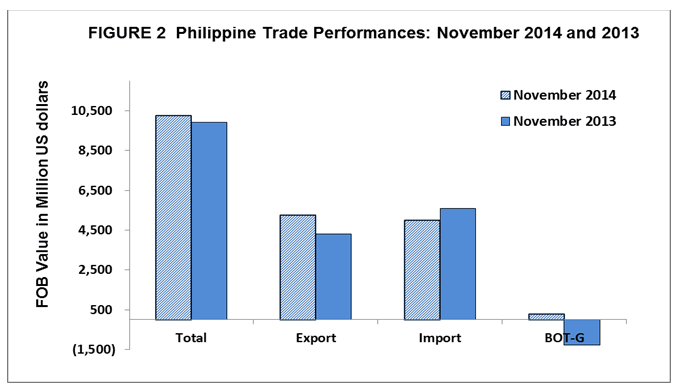
The balance of trade in goods (BOT-G) for the Philippines in November 2014 registered a surplus of $272 million compared to the $1.268 billion deficit in the same period last year.
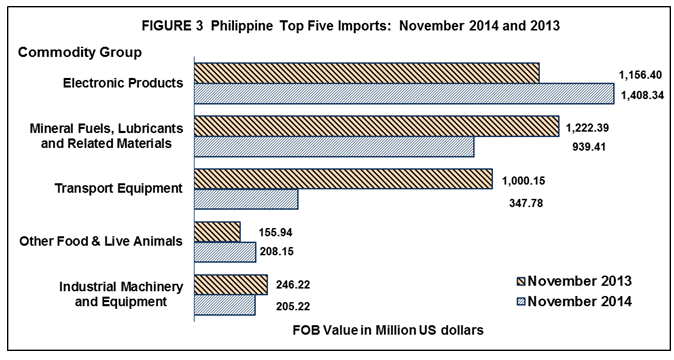
ELECTRONIC PRODUCTS ACCOUNTS FOR 28.2 PERCENT OF IMPORT BILL
Inward shipments of Electronic Products were the top imported commodity in November 2014, accounting for 28.2 percent of the aggregate import bill and value amounting to $1.408 billion. It increased by 21.8 percent over last year's figure of $1.156 billion. Among the major groups of electronic products, Components/Devices (Semiconductors), having the biggest share of 24.4 percent, increased by 48.0 percent to $1.220 billion in November 2014 compared from $824.10 million in November 2013.
Imports of Mineral Fuels, Lubricants and Related Materials ranked second with 18.8 percent share and reported value of $939.41 million in November 2014. It went down by 23.1 percent from $1.222 billion in November 2013.
Transport Equipment placed third with 7.0 percent share to total imports valued at $347.78 million compared from previous year’s level of $1.000 billion. It decelerated by 65.2 percent from November 2013 figure.
Other Food and Live Animals, contributing 4.2 percent to the total import bill was the country’s fourth top import for the month amounting to $208.15 million. It went up by 33.5 percent compared to last year’s value of $155.94 million.
Fifth in rank and with 4.1 percent share to the total imports, Industrial Machinery and Equipment recorded $205.22 million worth of imports. It registered a 16.7 percent decrease from its year ago level of $246.22 million.
Rounding up the list of the top ten imports for November 2014 were: Plastics in Primary and Non-Primary Forms valued at $199.64 million; Cereals and Cereal Preparations, $144.54 million; Iron and Steel, $130.25 million; Miscellaneous Manufactured Articles amounting to $117.37 million; and Feeding Stuff For Animals (Not Including Unmilled Cereals), $102.22 million.
Aggregate payment for the country’s top ten imports for November 2014 reached $3.803 billion or 76.2 percent of the total import bill.
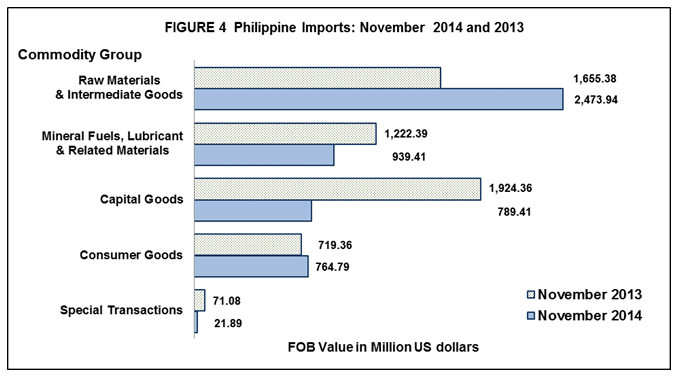
ALMOST HALF (49.6%) OF THE TOTAL IMPORTS WERE RAW MATERIALS AND INTERMEDIATE GOODS
Payments for purchases of Raw Materials and Intermediate Goods in November 2014 were valued at $2.474 billion and accounted for 49.6 percent of the total imports. It increased by 49.4 percent over last year's figure of $1.655 billion. Semi-Processed Raw Materials had the biggest share of 46.6 percent valued at $2.325 billion.
Mineral Fuels, Lubricants and Related Materials with 18.8 percent share to total imports, decreased by 23.1 percent from $1.222 billion in November 2013 to $939.41 million in November 2014. Petroleum crude contributed the biggest share of imports in this commodity group and accounted for 10.2 percent of total imports.
Payments for inward shipments of Capital Goods accounted for 15.8 percent of the total imports. It declined by 59.0 percent from $1.924 billion in November 2013 to $789.41 million in November 2014.
Purchases of Consumer Goods recorded 15.3 percent share with a total import bill valued at $764.79 million in November 2014. It increased by 6.3 percent from $719.36 million registered in November 2013.
Special Transactions went down by 69.2 percent from $71.08 million in November 2013 to $21.89 million recorded in November 2014.
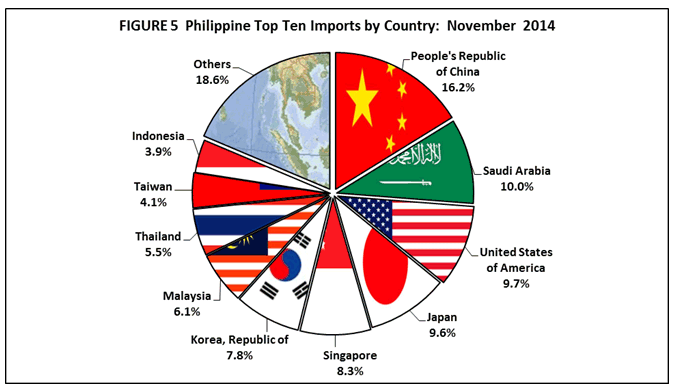
IMPORTS FROM PEOPLE’S REPUBLIC OF CHINA ACCOUNTS FOR 16.2 PERCENT
People’s Republic of China remained as the country’s biggest source of imports with 16.2 percent share in November 2014. Payments were recorded at $808.53 million, an increase of 20.6 percent from $670.46 million in November 2013. Revenue from country’s exports to China, on the other hand, reached $665.66 million, generating a total trade value of $1.474 billion and $142.87 million trade deficit.
Saudi Arabia was the second biggest source of imports for November 2014 with 10.0 percent share to the total import bill amounting to $499.35 million and increased by 111.3 percent from $236.32 million in November 2013. Exports to Saudi Arabia amounted to $6.55 million, yielding a two-way trade value of $505.91 million and a trade deficit of $492.80 million.
United States of America (USA) including Alaska and Hawaii came third, contributing 9.7 percent of the total import bill in November 2014, with import value of $483.16 million. It decreased by 42.0 percent from its November 2013 value of $833.59 million. Export receipts from USA in November 2014 reached $689.45 million yielding a total trade value of $1.173 billion and a trade surplus of $206.29 million.
Japan including Okinawa ranked fourth, accounting for 9.6 percent share of the total import bill in November 2014 with a positive growth of 14.0 percent to $480.95 million from $422.07 million in November 2013. Exports to this country amounted to $1.112 billion resulting to a total trade value of $1.593 billion and a trade surplus of $631.09 million.
Fifth in rank was Singapore accounting for 8.3 percent share of the total import bill worth $416.18 million in November 2014 and increased by 11.1 percent from $374.57 million in November 2013. Exports to Singapore amounted to $306.11 million resulting to a total trade value of $722.30 million and a trade deficit of $110.07 million.
Other major sources of imports for the month of November 2014 were: Republic of Korea, $389.12 million; Malaysia, $305.46 million; Thailand, $276.73 million; Taiwan, $205.04 million; and Indonesia, $194.89 million.
Aggregate payments for imports from the top ten sources for November 2014 amounted to $4.059 billion or 81.4 percent of the total.
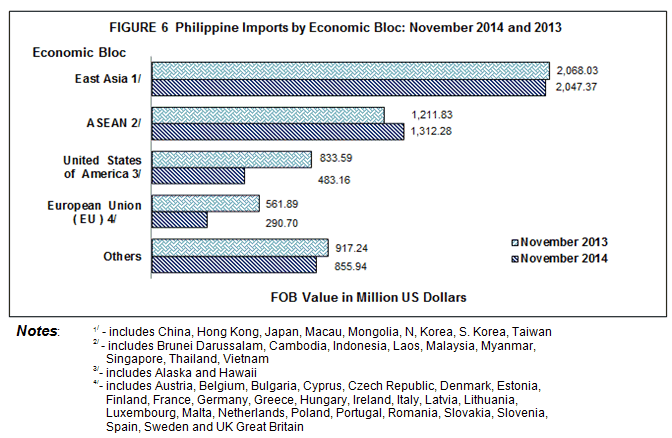
COMMODITIES IMPORTED FROM COUNTRIES IN EAST ASIA ACCOUNTS FOR 41.0 PERCENT
By economic bloc, East Asia (China, Hong Kong, Japan, Macau, Mongolia, North Korea, South Korea and Taiwan) was the biggest source of the country’s imports in November 2014 as it accounted for 41.0 percent of the total imports valued at $2.047 billion. It decreased by 1.0 percent from $2.068 billion in November 2013. Total exports to countries of East Asia amounted to $3.072 billion resulting to a total trade of $5.119 billion and a trade surplus of $1.025 billion.
Commodities imported from ASEAN member countries were valued at $1.312 billion, contributing 26.3 percent share and increased by 8.3 percent from $1.212 billion recorded in November 2013. Proceeds from exports to ASEAN member countries were worth $651.55 million, resulting to a total trade of $1.964 billion and a trade deficit of $660.73 million.
Imports from European Union were valued at $290.70 million. It declined by 48.3 percent compared to a year ago value of $561.89 million. Exports to member countries of European Union were worth $508.49 million, resulting to a total trade of $799.19 billion and a trade surplus of $217.79 million.
Technical Notes:
- Adjustments on electronic import statistics are based on the transactions that pass through the Electronic to Mobile (e2m) of the Bureau of Customs (BOC).
- Starting with the 2007 Press Release, analysis and tables are based on the 2004 Philippine Standard Commodity Classification (PSCC) groupings. This is in compliance with NSCB Resolution No. 03, Series of 2005 entitled “Approving and Adopting the 2004 Philippine Standard Commodity Classification” by all concerned government agencies and instrumentalities.
(Sgd.) LISA GRACE S. BERSALES, Ph. D.
National Statistician