
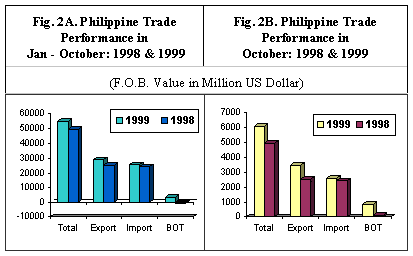
TOTAL TRADE STANDS AT $54.74 BILLION FOR THE FIRST 10-MONTHS
Two-way trade transactions for the first ten months of 1999 went up by 10.3 percent to $54.738 billion from $49.611 billion last year. Merchandise exports valued at $29.017 billion posted a 19.0 percent increase from $24.387 billion in 1998. Import payments amounted to $25.721 billion, which was 2.0 percent higher than $25.224 billion a year ago. The balance of trade in goods (BOT-G) was still at a surplus, up by 493.8 percent to $3.296 billion from deficit of $837 million (See Fig. 2A).
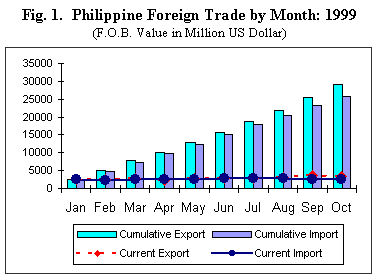
For the month of October 1999 alone, total merchandise trade valued at $6.071 billion increased by 22.4 percent from $4.959 billion last year. Receipts from exports rose by 36.1 percent to $3.459 billion from $2.542 billion while payments for imports reached $2.613 billion, which was 8.1 percent higher than $2.417 billion in 1998. The BOT-G stood at a surplus level of $846 million(See Fig. 2B).
ELECTRONICS AND COMPONENTS ACCOUNT FOR 23.5 PERCENT OF IMPORT BILL
Payments for Electronics and Components, still the country's top import with a 23.5 percent share, increased by 15.5 percent to $615.04 million from $532.43 million last year.
Payments for Mineral Fuels, Lubricants and Related Materials, the second top import accounting for 8.9 percent, amounted to $233.32 million. This was 34.7 percent higher than $173.20 million in 1998.
Telecommunication Equipment and Electrical Machinery accounted for 8.3 percent of the aggregate bill as purchases dropped by 4.2 percent to $217.58 million from $227.22 million a year ago.
The fourth top import for the month consisted of Industrial Machinery and Equipment. Payments, accounting for 6.4 percent of the total, went up by 2.3 percent to $166.10 million from $162.41 million last year.
Office and EDP Machines, accounting for 5.5 percent of the total, was in fifth spot with a value of $144.02 million, which was 1.9 percent higher than $141.31 million last year.
Materials/Accessories Imported on Consignment Basis for the Manufacture of Other Electrical and Electronic Machinery and Equipment comprised the sixth top import. Accounting for 4.4 percent of the total bill, payments reached $113.98 million, decreasing by 48.5 percent from $221.11 million a year earlier (See Fig. 3).
Rounding up the list of the top imports for October 1999 were Transport Equipment, $104.41 million; Iron and Steel, $93.18 million; Textile Yarn, Fabrics, Made-up Articles and Related Products, $88.15 million; andMiscellaneous Manufactured Articles, $72.13 million.
Aggregate payment for the top ten imports for the month amounted to $1.848 billion, or 70.7 percent of the total.

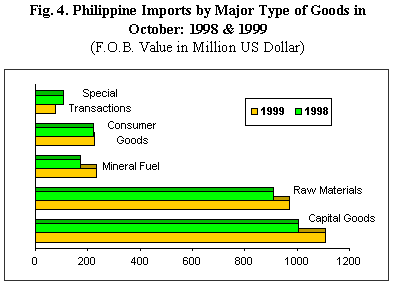
CAPITAL GOODS ACCOUNT FOR 42.5 PERCENT
Accounting for 42.5 percent of the import bill, Capital Goods emerged as the top import group for the month with aggregate payments reaching $1.110 billion or 10.3 percent higher than $1.006 billion a year ago.
Raw Materials and Intermediate Goods accounted for the second biggest slice of the import bill for the month placed at 37.1 percent. Actual payments amounted to $969.69 million and rose by 6.5 percent from $910.13 million last year.
Expenditures for Mineral Fuel and Lubricant was up by 34.7 percent to $233.33 million while payments for Special Transactions dropped by 30.6 percent to $74.71 million.
Purchases of Consumer Goods valued at $224.84 million was up by 2.2 percent from $220.02 million in 1998 (See Fig. 4).
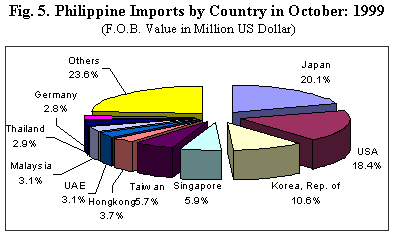
JAPAN CORNERS 20.1 PERCENT OF THE TOTAL BILL
With a 20.1 percent share of the total import bill, purchases of Japanese goods led all top import markets for the month despite a 0.5 percent slowdown. Payments amounted to $524.71 million, which was down from $527.40 million last year. Exports to Japan, on the other hand, amounted to $442.09 million yielding a two-way trade figure of $966.80 million and a BOT-G deficit of $82.62 million.
US, the second biggest source of imports with a 18.4 percent share, reported sales valued at $855.42 million against purchases amounting to $481.98 million. Total trade reached $1.337 billion and a BOT-G surplus stood at $373.44 million.
The third biggest source of imports for the month was the Republic of Korea.Expenditures for imports amounted to $276.95 million while revenue for exports reached $114.37 million resulting in a two-way trade value of $391.32 million and a $162.58 million BOT-G deficit.
Other major sources of imports for October 1998 were Singapore, $155.13 million; Taiwan, $149.27 million; Hongkong, $96.28 million; United Arab Emirates, $82.01 million; Malaysia, $81.91 million; Thailand, $75.17 million; and Germany, $72.63 million.
Payments for imports from the top ten sources amounted to $1.996 billion or 76.4 percent of the total (See Fig. 5).
UNCOLLECTED DOCUMENTS
As of press time 73 out of 76,852 export documents and 51 out of 109,711import documents are still expected from the ports.
Source: National Statistics Office
Manila, Philippines
| Attachment | Size |
|---|---|
|
|
6.39 KB |
|
|
5.05 KB |
|
|
7.03 KB |
|
|
5.44 KB |
|
|
9.82 KB |