
EXTERNAL TRADE PERFORMANCE
OCTOBER 2013
(Preliminary)
p - preliminary
r- revised
OCTOBER 2013 TOTAL TRADE STAND AT $9.850 BILLION
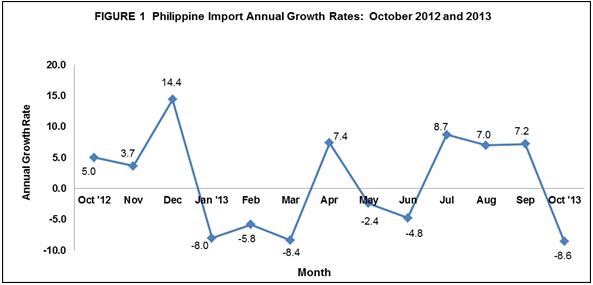
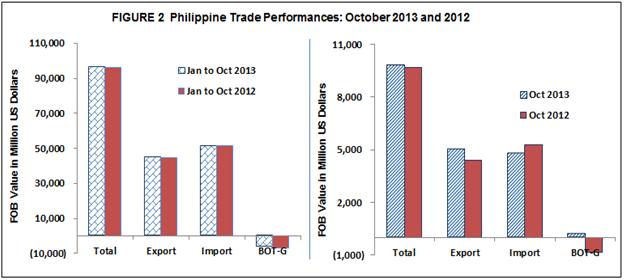
Total external trade in goods for October 2013 reached $9.850 billion, representing a 1.7 percent increase from $9.687 billion recorded during the same month in 2012. The total imports for October 2013 decreased by 8.6 percent while the total exports increased by 14.0 percent this year. Thus, the balance of trade in goods (BOT-G) for the country in October 2013 registered a surplus of $202 million from $867 million deficit in the same period last year.
IMPORTS DOWN BY 8.6 PERCENT IN OCTOBER 2013
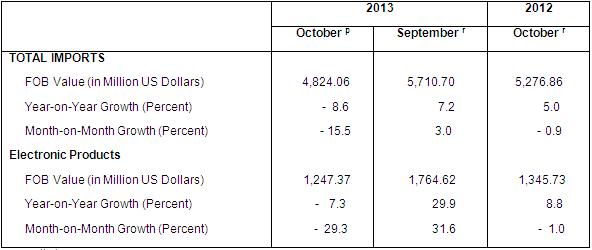
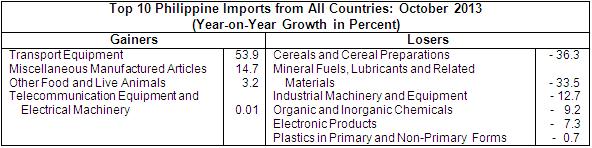
The country’s total imported goods for this month decreased by 8.6 percent from $5.277 billion in October 2012 to $4.824 billion for the same period this year. Similarly, on a monthly basis, it decreased by 15.5 percent compared to previous month’s level of $5.711 billion. The negative growth resulted from the decrease in imports of the following major commodity groups: cereals and cereal preparations; mineral fuels, lubricants and related materials; industrial machinery and equipment; organic and inorganic chemicals; electronic products; and plastics in primary and non-primary forms.
Aggregate imports for the first ten months of 2013 amounted to $51.183 billion and showed a 0.8 percent decrease compared with $51.621 billion for the same ten months of last year.
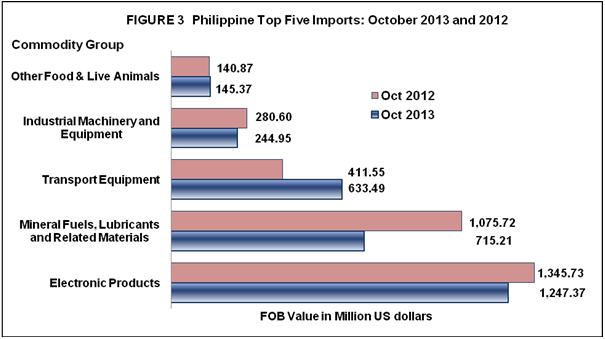
ELECTRONIC PRODUCTS ACCOUNT FOR 25.9 PERCENT OF IMPORT BILL
Electronic Products were the top imported commodity in October 2013, accounting for 25.9 percent and value amounting to $1.247 billion of the aggregate import bill. It decreased by 7.3 percent over last year's figure of $1.346 billion. On a monthly basis, it also went down by 29.3 percent from $1.765 billion recorded in September 2013. Among the major groups of electronic products, Components/Devices (Semiconductors), having the biggest share of 19.4 percent, decreased by 9.6 percent from $1.034 billion in October 2012 to $934.10 million in October 2013.
Imports of Mineral Fuels, Lubricants and Related Materials ranked second with 14.8 percent share and reported value of $715.21 million in October 2013. It went down by 33.5 percent from $1.076 billion in October 2012.
Transport Equipment placed third with 13.1 percent share to total imports valued at $633.49 million. It registered 53.9 percent increase, the highest year-on-year change among the top ten imports, compared to its previous year’s level of $411.55 million. However, compared to previous month, import decreased by 8.5 percent from $692.05 million.
Industrial Machinery and Equipment, contributing 5.1 percent to the total import bill, was the country’s fourth top import for the month amounting to $244.95 million. It went down by 12.7 percent compared to last year’s value of $280.60 million. Similarly, this product decelerated by 7.3 percent compared with last month.
Fifth in rank and with 3.0 percent share to the total imports, Other Food and Live Animals recorded $145.37 million worth of imports. It increased by 3.2 percent from its year ago level of $140.87 million.
Rounding up the list of the top ten imports for October 2013 were Cereals and Cereal Preparations valued at $122.97 million; Miscellaneous Manufactured Articles, $115.98; Plastics in Primary and Non-Primary Forms amounting to $115.55 million; Organic and Inorganic Chemicals, $111.38 million; and Telecommunication Equipment and Electrical Machinery, $108.85 million.
Aggregate payment for the country’s top ten imports for October 2013 reached $3.561 billion or 73.8 percent of the total import bill.
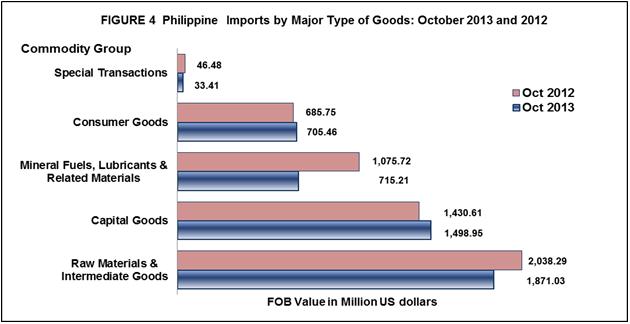
RAW MATERIALS AND INTERMEDIATE GOODS ACCOUNT FOR 38.8 PERCENT OF THE TOTAL IMPORTS
Payments in October 2013 for Raw Materials and Intermediate Goods accounted for 38.8 percent of the total imports and valued at $1.871 billion. It decreased by 8.2 percent over last year's figure of $2.038 billion. On a month-on-month basis, purchases also went down by 22.1 percent from $2.401 billion. Semi-Processed Raw Materials had the biggest share of 34.2 percent and valued at $1.651 billion.
Total imports of Capital Goods, comprising 31.1 percent of the total imports, went up by 4.8 percent to $1.499 billion in October 2013 from $1.431 billion in October 2012.
Mineral Fuels, Lubricants and Related Materials with 14.8 percent share to total imports decreased by 33.5 percent from $1.076 billion in October 2012 to $715.21 million in October 2013.
Purchases of Consumer Goods registered a 2.9 percent increase to $705.46 million in October 2013 from $685.75 million in October 2012. Special Transactions went down by 28.1 percent from $46.48 million to $33.41 million in October 2013.
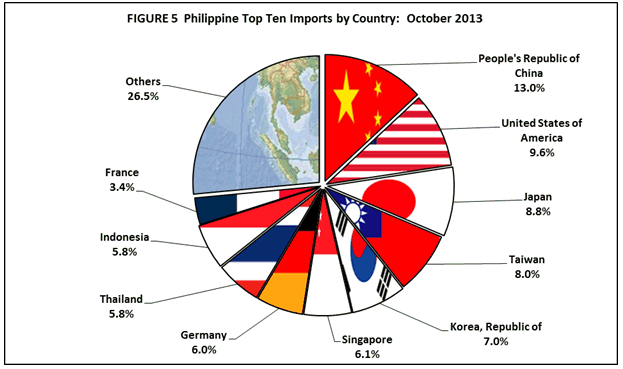
IMPORTS FROM PEOPLE’S REPUBLIC OF CHINA ACCOUNT FOR 13.0 PERCENT
People’s Republic of China was the country’s biggest source of imports with 13.0 percent share. Payments were recorded at $628.95 million, an increase of 5.9 percent from $593.85 million in October 2012. Revenue from country’s exports to China, on the other hand, reached $420.64 million, generating a total trade value of $1.050 billion and $208.31 million trade deficit.
United States of America (USA) including Alaska and Hawaii was second biggest source of imports for October 2013 with 9.6 percent share of the total import bill, lower by 24.1 percent from $606.66 million to $460.71 million in October 2013. Exports to USA amounted to $441.83 million, yielding a two-way trade value of $902.54 million and a trade deficit for the country of $18.88 million.
Japan including Okinawa came third, accounting for 8.8 percent share of the total import bill in October 2013 with a negative growth of 18.3 percent from $520.96 million to $425.70 million. Exports to Japan amounted to $889.28 million resulting to a total trade value of $1.315 billion and a trade surplus of $463.59 million.
Taiwan settled fourth accounting for 8.0 percent share of the total import bill in October 2013 or a decrease of 25.6 percent from $516.96 million to $384.82 million compared to same period. Exports to Taiwan amounted to $158.94 million resulting to a total trade value of $543.76 billion and a trade deficit of $225.88 million.
Fifth in rank was Republic of Korea, representing a 7.0 percent of the total import bill in October 2013 amounting to $338.81 million. Meanwhile, export receipts from Republic of Korea in October 2013 reached $137.67 million yielding a total trade value of $476.49 million and a trade deficit of $201.14 million.
Other major sources of imports for the month of October 2013 were: Singapore, $293.20 million; Germany, $290.28 million; Thailand, $281.35 million; Indonesia, $279.12 million; and France, $164.89 million.
Payments for imports from the top ten sources for October 2013 amounted to $3.548 billion or 73.5 percent of the total.
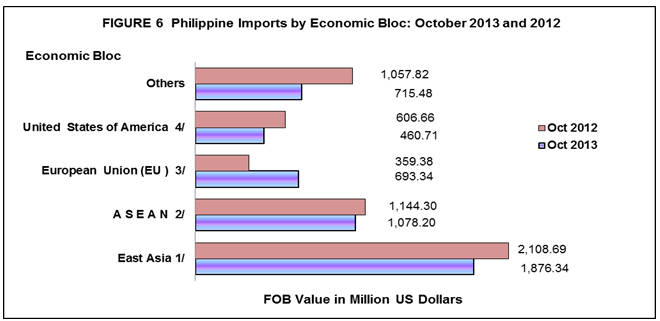
IMPORTS FROM EAST ASIA VALUED AT $1.876 BILLION
Philippines’ total imports in October 2013 from East Asia (China, Hong Kong, Japan, Macau, Mongolia, North Korea, South Korea and Taiwan) accounted for 38.9 percent of the county’s total imports with total payments of $1.876 billion, lower by 11.0 percent from $2.109 billion in October 2012. Total exports to member-countries of East Asia were valued at $1.953 billion resulting to a total trade of $3.829 billion and a balance of trade in goods (BOT-G) surplus of $76.31 million.
October 2013 imports from ASEAN member-countries registered at $1.078 billion, contributed 22.4 percent share, lower by 5.8 percent from $1.144 billion registered in October 2012. Exports to ASEAN member-countries were worth $911.23 million, resulting to a total trade of $1.989 billion and a trade deficit of $166.97 million.
Imports from European Union were valued at $693.34 million. It increased by 92.9 percent compared to a year ago recorded value of $359.38 million while exports to member-countries of European Union were worth $495.80 million. This aggregated to total trade of $1.189 billion and a trade deficit of $197.54 million.
Technical Notes:
- Adjustments on electronic import statistics are based on the transactions that pass through the Electronic to Mobile (e2m) of the Bureau of Customs (BOC).
- Starting with the 2007 Press Release, analysis and tables are based on the 2004 Philippine Standard Commodity Classification (PSCC) groupings. This is in compliance with NSCB Resolution No. 03, Series of 2005 entitled “Approving and Adopting the 2004 Philippine Standard Commodity Classification” by all concerned government agencies and instrumentalities.
CARMELITA N. ERICTA
Administrator
| Attachment | Size |
|---|---|
|
|
246.57 KB |
|
|
206.57 KB |
|
|
364.92 KB |
|
|
256.3 KB |
|
|
319.67 KB |
|
|
247.71 KB |
|
|
220.72 KB |
|
|
206.9 KB |
|
|
204.76 KB |