GENERAL WHOLESALE PRICE INDEX (GWPI)
(2012=100)
MAY 2020
Table A. Year-on-Year Growth Rates of the GWPI by Area, All Items
in Percent
(2012=100)
| Philippines | 1.9 | 2.3 | 1.2 | 2.4 |
| Luzon | 2.1 | 2.5 | 0.9 | 2.5 |
| Visayas | 0.4 | 0.7 | 2.4 | 2.0 |
| Mindanao | 1.6 | 1.2 | 2.2 | 1.4 |
Source: Survey of Wholesale Prices of Selected Commodities for the GWPI, Philippine Statistics Authority
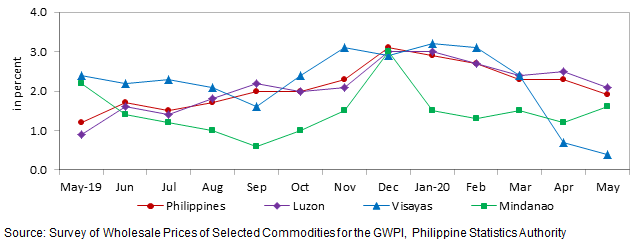
Figure 1. Growth Rates of the GWPI by Area, All Items
May 2019 - May 2020
(2012=100)

1. Annual rate of GWPI at the national level moves up at a slower pace
The annual rate of increase of GWPI at the national level slowed down to 1.9 percent in May 2020, from an annual increase of 2.3 percent in the previous month. In May 2019, its annual rate was posted at 1.2 percent. (Table A and Table 2)
Annual declines were still registered in the indices of mineral fuels, lubricants, and related materials at 15.2 percent; chemicals including animal and vegetable oils and fats, 1.0 percent; and miscellaneous manufactured articles, 0.2 percent. Moreover, slower annual gains were noted in the indices of food at 3.7 percent; manufactured goods classified chiefly by materials, 3.0 percent; and machinery and transport equipment, 0.6 percent.
On the other hand, annual mark-ups were higher in the indices of beverages and tobacco at 6.4 percent; and crude materials, inedible except fuels at 17.3 percent. (Table 2)
2. Annual rate of GWPI in Luzon slowly picks up
The annual increment of GWPI in Luzon likewise eased to 2.1 percent in May 2020. Its annual rate in April 2020 was posted at 2.5 percent and in May 2019, 0.9 percent. (Table A and Table 2)
The annual growth rates went down in the indices of mineral fuels, lubricants, and related materials by 16.1 percent; chemicals including animal and vegetable oils and fats, 1.4 percent; and miscellaneous manufactured articles, 0.2 percent. In addition, annual hikes were slower in the indices of the following commodity groups:
a. Food, 4.2 percent;
b. Beverages and tobacco, 5.8 percent;
c. Manufactured goods classified chiefly by materials, 3.2 percent; and
d. Machinery and transport equipment, 0.6 percent.
Meanwhile, a higher annual gain of 17.8 percent was noted in the index of crude materials, inedible except fuels. (Table 2)
3. Annual growth of GWPI in Visayas decelerates
The annual change of GWPI in Visayas moved up at a slower pace of 0.4 percent in May 2020. In the previous month, its annual increment was posted at 0.7 percent and in May 2019, 2.4 percent. (Table A and Table 2)
Downward movements in the annual rates were recorded in the indices of food at 0.2 percent; mineral fuels, lubricants, and related materials, 10.0 percent; and manufactured goods classified chiefly by materials, 0.01 percent.
On the other hand, annual increases were faster in the indices of crude materials, inedible except fuels at 11.9 percent; and chemicals including animal and vegetable oils and fats at 1.8 percent. The indices of other commodity groups retained their previous month’s annual growth rates. (Table 2)
4. Annual rate of GWPI in Mindanao climbs
The annual rate of GWPI in Mindanao went up by 1.6 percent in May 2020. In the previous month, its annual rate was recorded at 1.2 percent and in May 2019, 2.2 percent. (Table A and Table 2)
Compared with their annual growth rates in April 2020, annual increments were higher in the indices of food at 1.9 percent; beverages and tobacco, 9.4 percent; and crude materials, inedible except fuels, 17.1 percent. In addition, the annual rate in the index of chemicals including animal and vegetable oils and fats rose by 0.6 percent, from an annual decline of 0.7 percent in the previous month.
Meanwhile, the annual increase in the index of manufactured goods classified chiefly by materials slowed down to 1.5 percent during the month. Moreover, annual decreases were still noted in the indices of mineral fuels, lubricants, and related materials; and miscellaneous manufactured articles at 6.5 percent and 0.6 percent, respectively. Annual movement in the index of machinery and transport equipment remained at 0.6 percent. (Table 2)
See more at the General Wholesale Price Index Main page.
