

A. Total Agricultural Trade
1. Total agricultural trade posted a positive growth of 5.5 percent
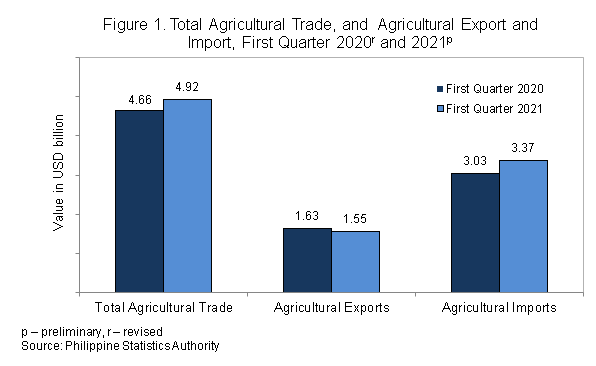
The country’s total agricultural trade in the first quarter of 2021, which amounted to USD 4.92 billion, increased at an annual rate of 5.5 percent. In the fourth quarter of 2020, total agricultural trade recorded an annual decline of -89.5 percent, while in the first quarter of 2020, trade decreased by -89.3 percent.
During the first quarter of 2021, agricultural exports and imports were recorded at USD 1.55 billion (31.5%) and USD 3.37 billion (68.5%), respectively. (Figure 1 and Table 1)
2. Agricultural trade balance grew by 29.7 percent
In the first quarter of 2021, the total balance of trade in agricultural goods was USD -1.82 billion. This reflects a deficit with an annual increase of 29.7 percent. In the fourth quarter of 2020, the annual decrease of trade deficit was recorded at -82.5 percent, while in the first quarter of 2020, trade deficit posted an annual decline of -86.4 percent. (Table 1)
B. Agricultural Export
1. Agricultural export declined by -4.9 percent
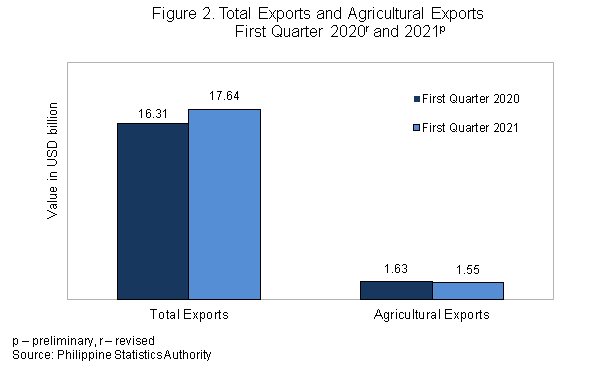
The country’s agricultural export revenue decreased to USD 1.55 billion or by -4.9 percent in the first quarter of 2021, from USD 1.63 billion in the first quarter of 2020. During the period, the value of agricultural export shared 8.8 percent to the total export of the country. (Figure 2 and Table 1)
2. Agricultural export of edible fruit and nuts; peel of citrus fruit melons commodity group contributed the largest share to total agricultural export
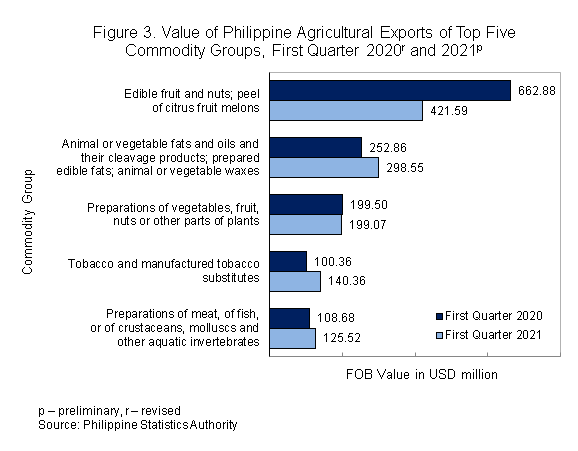
The total value of agricultural exports of the top 10 commodity groups reached USD 1.47 billion or 94.6 percent of the total agricultural export revenue in the first quarter of 2021. The combined export value of these top 10 commodity groups posted an annual decrement of -6.3 percent during the quarter.
Among the commodity groups, edible fruit and nuts; peel of citrus fruit melons, valued at USD 421.59 million, comprised the largest share of 27.2 percent to the total agricultural exports. (Figure 3 and Table 3)
3. Malaysia led as trading partner in agricultural exports among ASEAN member countries
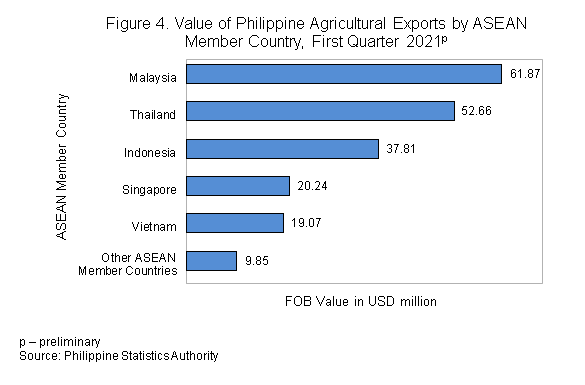
The country’s agricultural exports to ASEAN member countries in the first quarter of 2021 amounted to USD 201.51 million which accounted for almost 7.0 percent of the total exports to ASEAN member countries. Among the ASEAN member countries, Malaysia was the top buyer of agricultural exports worth USD 61.87 million or a share of 30.7 percent to the total agricultural exports to ASEAN member countries. (Figure 4 and Table 7)
4. Tobacco and manufactured tobacco substitutes commodity group led export of agricultural commodities to ASEAN member countries
The top three major agricultural commodities exported to ASEAN member countries in the first quarter of 2021 were:
a. tobacco and manufactured tobacco substitutes, USD 73.15 million;
b. animal or vegetable fats and oils and their cleavage products; prepared edible fats; animal or vegetable waxes, USD 46.35 million; and
c. preparations of cereals, flour, starch or milk; pastrycooks' products, USD 14.98 million. (Table 7)
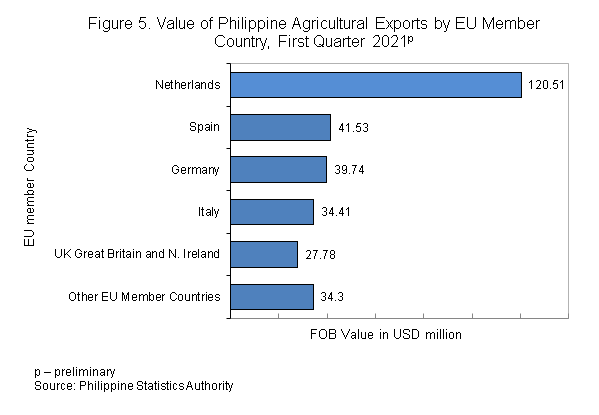
5. Netherlands was the country’s major trading partner in export of agricultural goods among EU member countries
Exports of agricultural goods to European Union member countries in the first quarter of 2021 amounted to USD 298.27 million which comprised 14.2 percent of the country’s total exports to EU member countries.
Among the EU member countries, Netherlands was the country’s top destination of agricultural commodities worth USD 120.51 million or 40.4 percent of the total agricultural exports to EU member countries. (Figure 5 and Table 9)
6. Animal or vegetable fats and oils and their cleavage products; prepared edible fats; animal or vegetable waxes commodity group was the top agricultural export to EU member countries
The top three major agricultural commodities exported to EU member countries in the first quarter of 2021 were:
a. animal or vegetable fats and oils and their cleavage products; prepared edible fats; animal or vegetable waxes, USD 129.55 million;
b. preparations of meat, of fish or of crustaceans, molluscs, and other aquatic invertebrates, USD 63.47 million; and
c. preparation of vegetables, fruit, nuts or other parts of plants, USD 34.06 million. (Table 9)
C. Agricultural Import
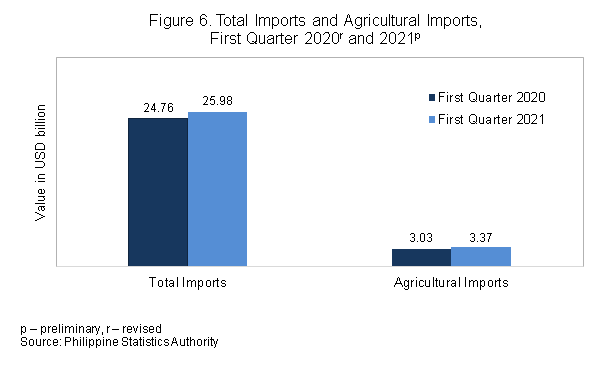
1. Agricultural import increased by 11.1 percent
The total agricultural imports amounted to USD 3.37 billion or a share of 13.0 percent to the country’s total imports in the first quarter of 2021. The total agricultural imports went up by 11.1 percent during the period compared to its value of USD 3.03 billion in the first quarter of 2020. (Figure 6 and Table 1).
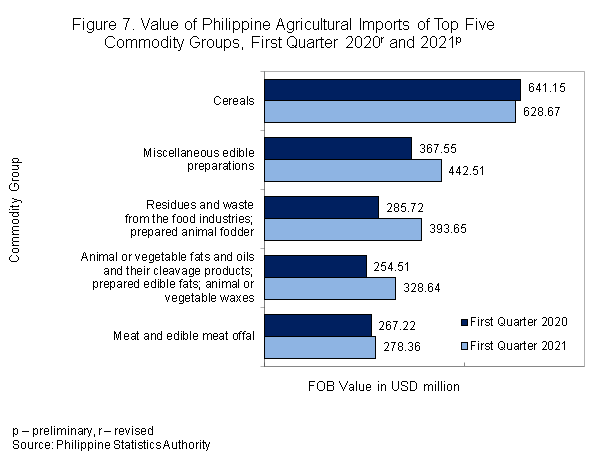
2. Cereals commodity group accounted for the highest value of agricultural imports
Among the major commodity groups, cereals, with a value of USD 628.67 million, contributed the largest share of 18.7 percent to the total agricultural imports in the first quarter of 2021. (Figure 7 and Table 5)
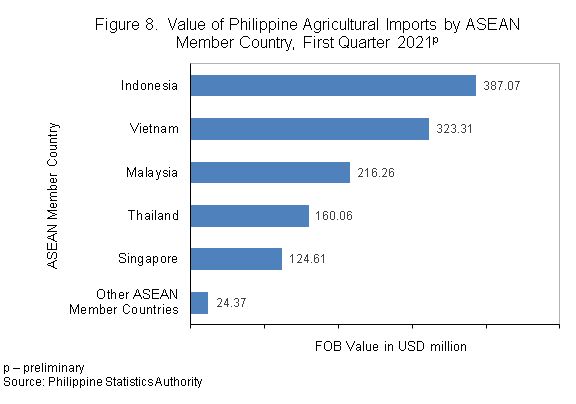
3. Indonesia accounted for the highest import value among ASEAN member countries
The country’s agricultural imports from ASEAN member countries in the first quarter of 2021 amounted to USD 1,235.67 million or 16.7 percent of the total imports from ASEAN member countries. Indonesia, which contributed USD 387.07 million or 31.3 percent of the total agricultural imports from ASEAN member countries, was the major source of agricultural products in the first quarter of 2021. (Figure 8 and Table 8)
4. Miscellaneous edible preparations commodity group topped agricultural commodities imported from ASEAN member countries
The top three imported agricultural goods from ASEAN member countries in the first quarter of 2021 were:
a. miscellaneous edible preparations, USD 332.98 million;
b. animal or vegetable fats and oils and their cleavage products; prepared edible fats; animal or vegetable waxes, USD 312.32 million; and
c. cereals, USD 254.51 million. (Table 8)
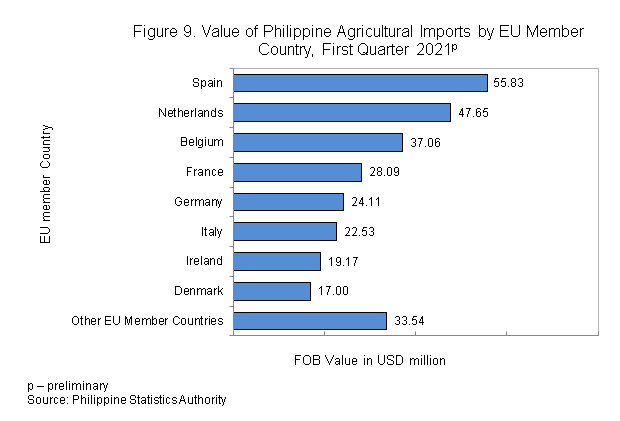
5. Spain led EU member countries on agricultural imports
The country’s agricultural imports from EU member countries amounted to USD 284.98 million or a share of 16.6 percent to the total imports from EU member countries in the first quarter of 2021. Among EU member countries, Spain was the country’s top supplier of agricultural commodities valued at USD 55.83 million or a share of 19.6 percent to the total agricultural imports from EU member countries. (Figure 9 and Table 10)
6. Meat and edible meat offal commodity group ranked first in terms of import from EU member countries
The top three agricultural commodities imported from EU member countries in the first quarter of 2021 were:
a. meat and edible meat offal, USD 100.46 million;
b. dairy produce; birds’ eggs; natural honey; edible products of animal origin, not elsewhere classified, USD 57.88 million; and
c. residues and waste from the food industries; prepared animal fodder, USD 29.92 million. (Table 10)
DENNIS S. MAPA, Ph.D.
Undersecretary
National Statistician and Civil Registrar General
EXPLANATORY NOTES
This Special Release features the preliminary figures for the imports and exports statistics of agricultural commodities of the Philippines for the first quarter of 2021. The agricultural exports and imports contained in this report are compiled by the Philippine Statistics Authority (PSA) from documents collected from the Bureau of Customs.
Commodity Classification
The commodities are classified in accordance with the 10-digit 2015 Philippine Standard Commodity Classification (PSCC). The agricultural commodity groups are those in chapters 01 to 24 of the 2015 PSCC. These chapters pertain to commodity classifications for live animals, meat and edible meat offal, fish and crustaceans, molluscs and other aquatic invertebrates, dairy produce; birds’ eggs; natural honey; edible products of animal origin, not elsewhere classified, products of animal origin, not elsewhere specified or included, vegetables products, edible vegetables and certain roots and tubers, edible fruit and nuts; peel of citrus fruit melons, coffee, tea, mate and spices, cereals, malt, starches, inulin, wheat gluten, oil seeds and oleaginous fruits, miscellaneous grains, seeds and fruit, industrial or medicinal plants, straw and fodder, lac, gums, resins, gum-resins and oleoresins, vegetable plaiting materials, animal or vegetable fats and oils, waxes, prepared foodstuffs, beverages, spirits, vinegar, and tobacco (manufactured and unmanufactured).
Valuation
The valuation used for foreign trade of agricultural commodities adopts the World Trade Organization agreement on customs valuation and this applies to both imports and exports. Exports of agricultural commodities utilized the free on board (FOB) value, also known as the cost of goods. FOB is the value of the goods free on board the carrier at the frontier of the exporting country. It includes inland freight, export duty, and other expenses. Ocean freight, insurance, and consular fees, however, are excluded. On the other hand, imports of agricultural commodities use the cost of insurance and freight values which include the transaction value of the goods, the value of services performed to deliver goods to the border of the exporting country, and the value of services performed to deliver the goods from the border of the exporting country to the border of the importing country.1
Processing and Dissemination of Results
All documents (hard copies and electronic files) received within the cut-off date, which is 55 days after the reference quarter, are compiled, processed, summarized, analyzed, and disseminated through quarterly statistical tables and special releases.
The quarterly preliminary results of export and import statistics for agricultural commodities in the Philippines are disseminated in the form of special releases (SR). The quarterly SR is posted 75 days after the reference quarter at the PSA website (https://psa.gov.ph/statistics/annual-foreign-trade).
All documents received after the cut-off date are included in the generation of the revised results. The revised data of the previous quarter are reported during the release of the preliminary report of the next quarter. Revisions are made for the previous quarters until the annual report is released four months after the reference year.
Data request on imports and exports of agricultural commodities can be made at the PSA through the Trade Statistics Division of the Economic Sector Statistics Service with telephone number (02) 8376-1975 and email address tsd.staff@psa.gov.ph.
1. Source: IMTS Concepts and Definitions 2010, page 40 chapter 4. The value of transaction is expressed in US dollar.
| Attachment | Size |
|---|---|
|
|
449.33 KB |
|
|
212.31 KB |