
Table A. Summary of External Trade Performance
April 2020, March 2020 and April 2019
| Indicator | April 2020p | March 2020r | April 2019 | |||
| FOB Value (in Million USD) |
Year-on-Year Growth (%) |
FOB Value (in Million USD) |
Year-on-Year Growth (%) |
FOB Value (in Million USD) |
Year-on-Year Growth (%) |
|
| Total external trade | 6,066.22 | -59.8 | 11,453.86 | -25.6 | 15,103.41 | 3.0 |
| Balance of trade | -499.21 | -86.9 | -2,368.29 | -29.0 | -3,798.96 | 2.7 |
| Exports | 2,783.51 | -50.8 | 4,542.78 | -24.7 | 5,652.23 | 3.1 |
| Imports | 3,282.71 | -65.3 | 6,911.07 | -26.2 | 9,451.19 | 2.9 |
| p – preliminary, r – revised | ||||||
A. TOTAL EXTERNAL TRADE AND BALANCE OF TRADE
1. Total external trade and trade deficit shrink
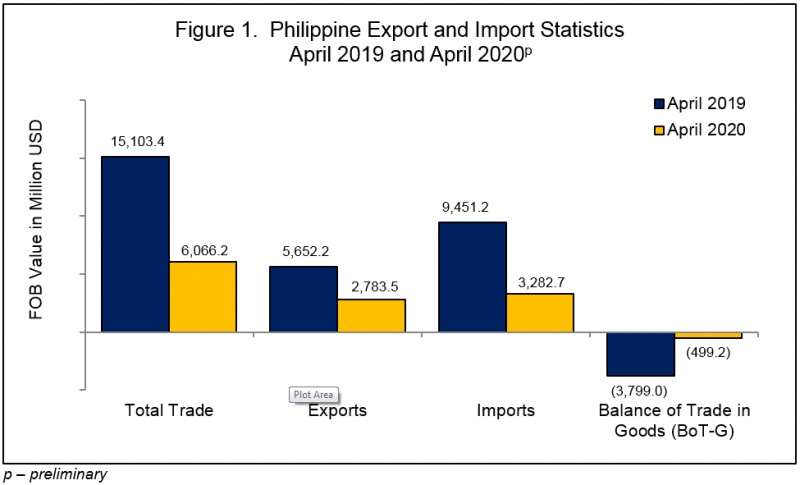
The country’s total external trade in goods in April 2020, which amounted to USD 6.07 billion, declined at a faster rate of 59.8 percent than its previous month’s annual drop of 25.6 percent. Of the total external trade, more than half (54.1%) were imported goods and the rest were exported goods.
The country’s balance of trade in goods (BoT-G) in April 2020 drastically declined to USD 0.50 billion or an annual drop of 86.9 percent. In March 2020, the annual decline in trade deficit was slower at 29.0 percent. On the contrary, trade deficit grew at an annual rate of 2.7 percent in April 2019. (Figure 1 and Table A)
B. EXPORTS
1. Sales from export plunges
The country’s total export sales in April 2020 amounted to USD 2.78 billion, a decrease of 50.8 percent from the USD 5.65 billion total export generated in April 2019. This contraction was the highest recorded annual decrease in export sales since January 2009. In the previous month, the annual decline was slower at 24.7 percent while in April 2019, exports grew at annual rate of 3.1 percent. (Figure 1 and Table A)
Largely contributing to the downtrend in April 2020 were seven of the top 10 major export commodities led by other manufactured goods (-64.0%); machinery and transport equipment (-63.6%); and coconut oil (-55.5%). (Table B and Table 3)
Table B. Top 10 Philippine Exports to All Trading Partners, April 2020p
Year-on-Year Growth
| Gainers | Losers | ||
| Major Commodity Group | Annual Growth Rate, % | Major Commodity Group | Annual Growth Rate, % |
| Petroleum Products | 1,755.3 | Other Manufactured Goods | -64.0 |
| Cathodes and Sections of Cathodes, of Refined Copper | 80.4 | Machinery and Transport Equipment | -63.6 |
| Pineapple and Pineapple Products | 25.7 | Coconut Oil | -55.5 |
| Electronic Products | -48.6 | ||
| Other Mineral Products | -46.7 | ||
| Bananas (Fresh) | -28.0 | ||
| Gold | -9.5 | ||
| p – preliminary | |||
2. Electronic products commodity group remains the highest on export sales
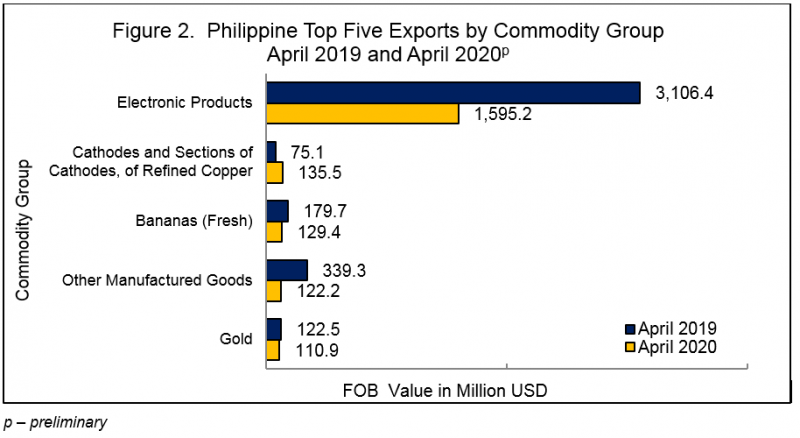
By commodity group, exports of electronic products continued to be the country’s top export with total earnings of USD 1.60 billion. This amount, which accounted for 57.3 percent of the total exports in April 2020, decreased annually by 48.6 percent, from USD 3.11 billion in April 2019. (Figure 2 and Table 3)
3. Manufactured goods still comprise the biggest chunk in total exports
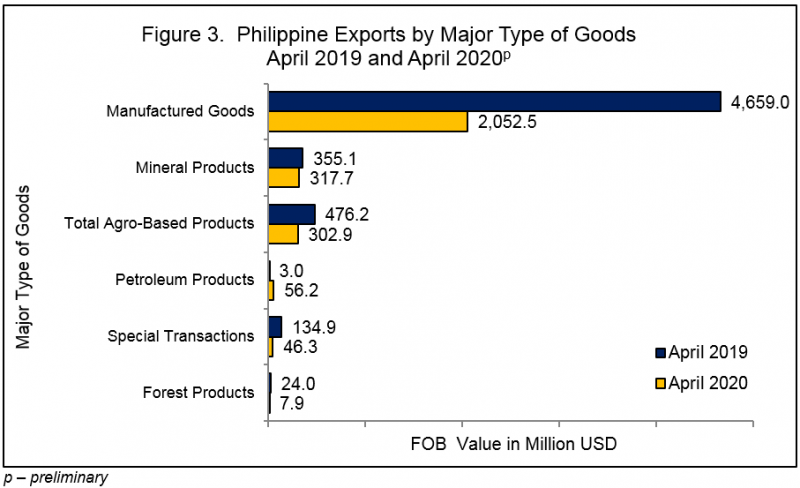
By major type of goods, exports of manufactured goods shared the highest to total exports in April 2020 amounting to USD 2.05 billion (73.7%). However, exports for this type of goods went down by 55.9 percent, from its level a year ago of USD 4.66 billion. (Figure 3 and Table 5)
4. Hong Kong contributes the highest export value
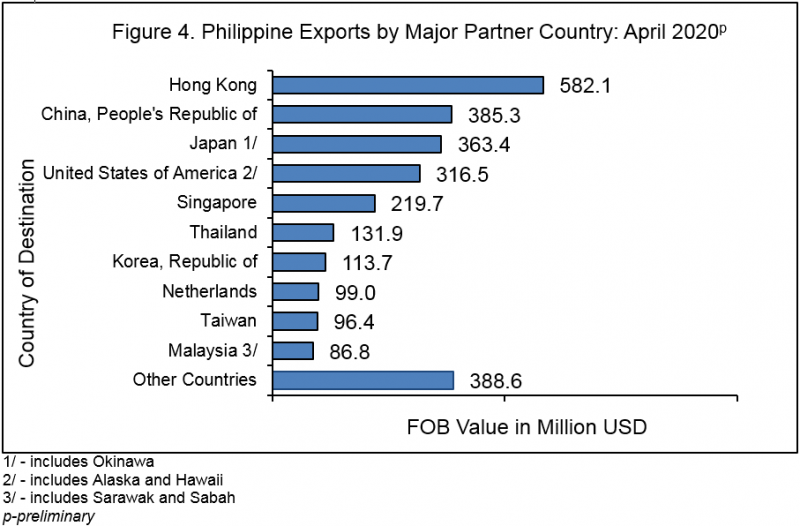
By major trading partner, exports to Hong Kong comprised the highest value amounting to USD 582.07 million (20.9%) during the month. Exports to this country decreased by 17.5 percent, from USD 705.54 million in April 2019.
Completing the top five major export trading partners were People’s Republic of China with export value of USD 385.28 million (13.8%); Japan, USD 363.40 million (13.1%); United States of America (USA), USD 316.54 million (11.4%); and Singapore, USD 219.73 million (7.9%). (Figure 4 and Table 7)
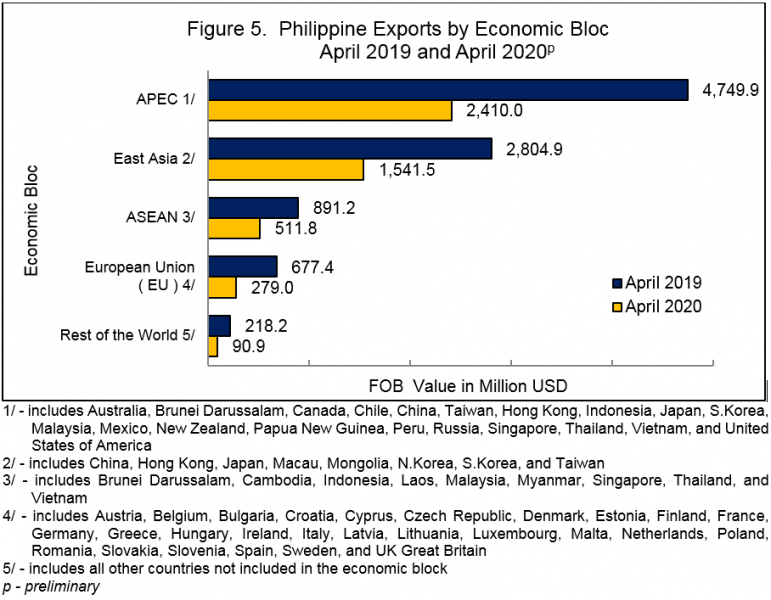
5. Majority of exports are for APEC countries
By economic bloc, USD 2.41 billion (86.6%) of the country’s merchandise exports in April 2020 went to Asia-Pacific Economic Cooperation (APEC) member countries. However, export value to APEC countries dropped by 49.3 percent, from USD 4.75 billion in April 2019. (Figure 5 and Table 8)
C. IMPORTS
1. Imports value drops by 65.3 percent
Total imported goods in April 2020, which amounted to USD 3.28 billion, plunged at an annual rate of 65.3 percent. This was the highest annual decline recorded since April 2009. In the previous month, the decline was slower at 26.2 percent while in April 2019, imports grew by 2.9 percent annually. (Figure 1 and Table A)
The decrement of imported goods in April 2020 was due to the decreases in the top 10 major import commodities led by transport equipment (-89.8%); mineral fuels, lubricants and related materials (-87.4%); and miscellaneous manufactured articles (-75.5%). (Table C and Table 9)
Table C. Top 10 Philippine Imports from All Trading Partners
April 2020p
Year-on-Year Growth
| Major Commodity Group | Annual Growth Rate, % |
| Transport Equipment | -89.8 |
| Mineral Fuels, Lubricants and Related Materials | -87.4 |
| Miscellaneous Manufactured Articles | -75.5 |
| Other Food and Live Animals | -71.5 |
| Industrial Machinery and Equipment | -70.8 |
| Telecommunication Equipment and Electrical Machinery | -56.0 |
| Iron and Steel | -48.5 |
| Electronic Products | -46.0 |
| Power Generating and Specialized Machinery | -43.0 |
| Medicinal and Pharmaceutical Products | -37.9 |
| p – preliminary | |
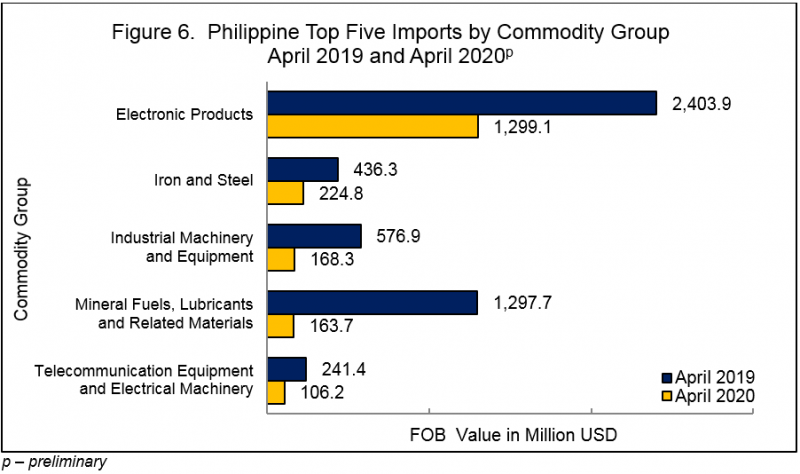
2. Electronic products account for the highest import value among commodity groups
Among the imported commodity groups, electronic products, valued at USD 1.30 billion, contributed the highest share of 39.6 percent to the total imports in April 2020. Import value for this commodity group, however, declined by 46.0 percent in April 2020, from USD 2.40 billion in April 2019. (Figure 6 and Table 9)
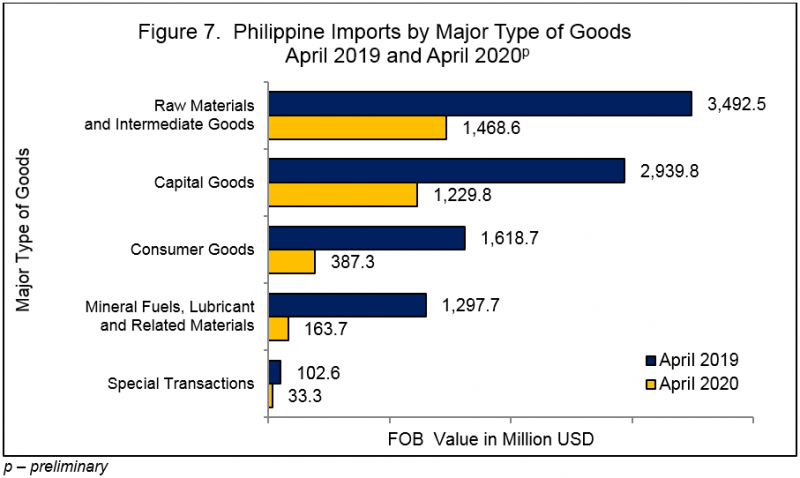
3. Imports of raw materials and intermediate goods contribute the highest
By major type of goods, imports of raw materials and intermediate goods accounted for the largest share of USD 1.47 billion (44.7%) in April 2020. This type of goods, however, dropped by 58.0 percent, from USD 3.49 billion in April 2019.
Imports of capital goods, which shared USD 1.23 billion (37.5%), ranked second. This was followed by consumer goods with a share of USD 0.39 billion (11.8%). (Figure 7 and Table 11)
4. Import of Personal Protective Equipment (PPE) and medical supplies grew quickly
Import value for Personal Protective Equipment (PPE) and medical supplies in April 2020 amounted to USD 20.9 million, indicating an annual increase of 37.9 percent. In the previous month, these medical items, with an import value of USD 15.5 million, dropped at an annual rate of 11.4 percent.
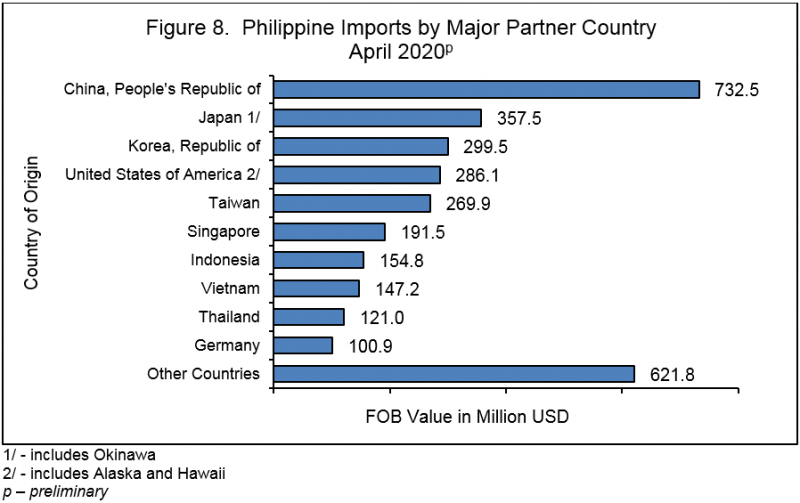
5. People’s Republic of China has the highest import value
The People’s Republic of China was the country’s biggest supplier of imported goods with 22.3 percent share to the total imports in April 2020. Import value from this country amounted to USD 732.47 million during the month, from USD 2,251.53 million in April 2019.
The next four major import trading partners were Japan with import value of USD 357.55 million (10.9%); Republic of Korea, USD 299.54 million (9.1%); USA, USD 286.13 million (8.7%); and Taiwan, USD 269.85 million (8.2%). (Figure 8 and Table 13)
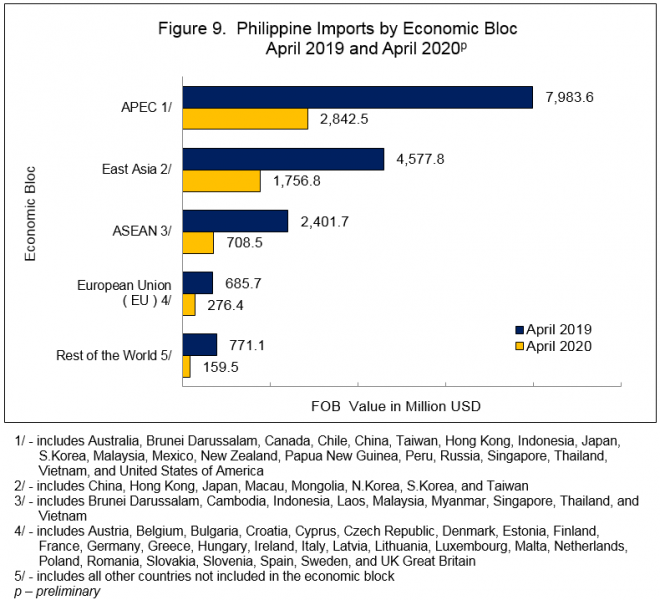
6. Imports come largely from APEC member countries
By economic bloc, APEC member countries were the biggest supplier of the country’s imported goods in April 2020 with a value of USD 2.84 billion (86.6%). This amount, however, went down by 64.4 percent, from USD 7.98 billion in April 2019. (Figure 9 and Table 14)
CLAIRE DENNIS S. MAPA, Ph.D.
Undersecretary
National Statistician and Civil Registrar General
Explanatory Notes
Export and import trade statistics are compiled by the Philippine Statistics Authority (PSA) from export and import documents submitted to the Bureau of Customs (BOC) by exporters and importers or their authorized representatives as required by law. The PSA regularly collects the following documents:
1. Export Declaration (ED – DTI form);
2. Import Entry and Internal Revenue Declaration (BOC IEIRD Form 236);
3. Informal Import Declaration and Entry (BOC Form 177); and
4. Single Administrative Documents (SAD)
The digitized copies of all documents are provided by BOC and PEZA to PSA on a monthly basis through email.
The output of the Automated Export Documentation System (AEDS) of the BOC is being utilized to generate export statistics. AEDS is a paperless transaction in lieu of the manual filling up of export documents.
Moreover, an electronic copy of the IEIRD, or SAD, is utilized to capture the monthly import figures. SAD-IEIRD is an on-line submission of import documents either by brokers or companies. These are transactions that pass through the Automated Cargo Operating System (ACOS), now called the e2m (electronic to mobile) customs system, which is implemented through the BOC e-Customs Project.
All documents (hard copies and e-files) received within the cut-off date, which is every 30th day of the month, are compiled, processed, summarized, analyzed and disseminated through monthly statistical tables, and press releases. Processing includes coding, editing, review and validation of results. All documents received after the cut-off date are included in the generation of the revised monthly statistical tables which are available 10 to 15 working days after the press release date.
The press release for a reference month is every 40th day after the reference month. However, if the 40th day falls on a Saturday, the release is made a day earlier (Friday). If it falls on a Sunday or Monday, the release is on Tuesday. Moreover, If the release date falls on a holiday, the date of release is moved accordingly.
The 2015 Philippine Standard Commodity Classification (PSCC) is used to classify the commodities at 10-digit code level for statistical purposes.
Data requests on international merchandise trade statistics can be made at the PSA, Economic Sector Statistics Service, Trade Statistics Division (telephone number: (02) 8376-1975 or at email address, j.soliven@psa.gov.ph).
See more at the Foreign Trade Statistics main page.
| Attachment | Size |
|---|---|
|
|
117.09 KB |
|
|
346.83 KB |