
A. TOTAL EXTERNAL TRADE AND BALANCE OF TRADE
1. Total external trade increased
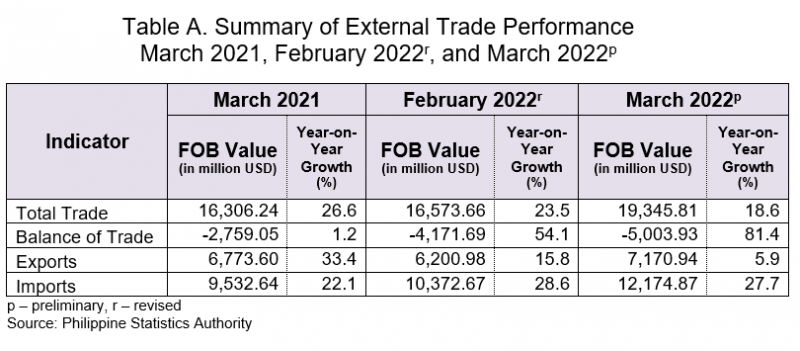
In March 2022, the country’s total external trade in goods amounted to USD 19.35 billion which indicates an annual growth rate of 18.6 percent. In the previous month, the annual increase was faster at 23.5 percent, while in March 2021, it grew by 26.6 percent. (Table A)
Of the total external trade in March 2022, 62.9 percent were imported goods, while the rest were exported goods.
2. Trade deficit posted an annual increase
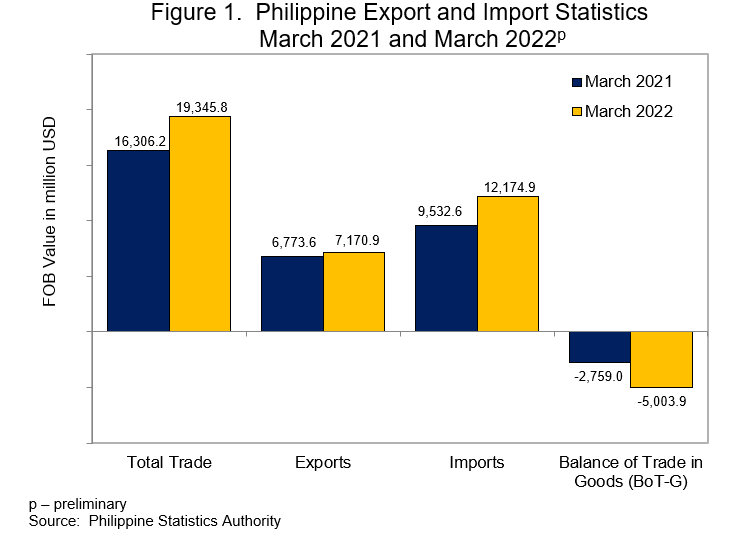
Balance of trade in goods (BoT-G) is the difference between the value of export and import. BoT-G in March 2022 amounted to USD -5.00 billion, indicating a trade deficit with an annual increase of 81.4 percent. The trade deficit in the previous month recorded an annual increase of 54.1 percent, while in March 2021, it was at 1.2 percent. (Figure 1, Tables A and 2)
B. EXPORTS
1. Sales from export posted a positive growth
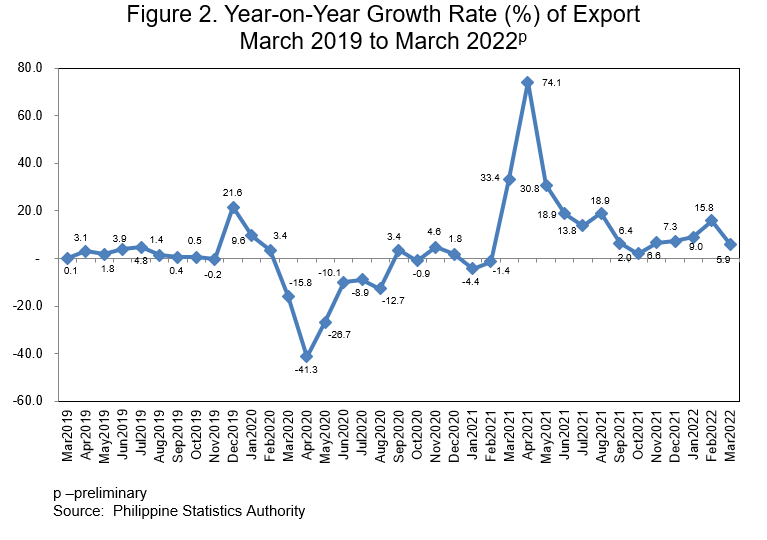
The country’s total export sales in March 2022, amounting to USD 7.17 billion, increased at an annual rate of 5.9 percent, from an increment of 15.8 percent in the previous month. In March 2021, total export sales grew at an annual rate of 33.4 percent. (Figures 1 and 2, Tables A and 2)
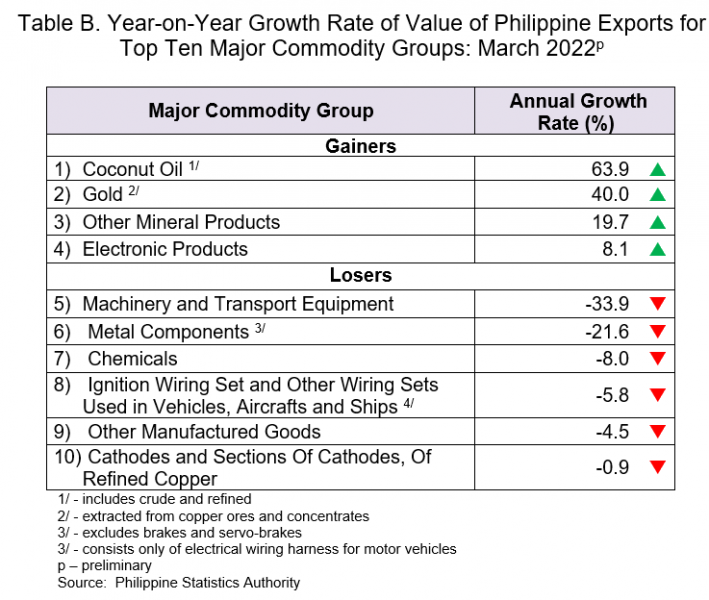
Of the top 10 major commodity groups, four recorded annual increases in terms of the value of exports, which was led by coconut oil (63.9%). This was followed by gold (40.0%), and other mineral products (19.7%). (Tables B and 3)
2. Year-to-date annual total export increased
The year-to-date annual total export earnings, that is from January 2022 to March 2022, amounted to USD 19.42 billion. This represents an annual increase of 9.8 percent compared with the year-to-date annual total export value earned in January 2021 to March 2021. (Table 4)
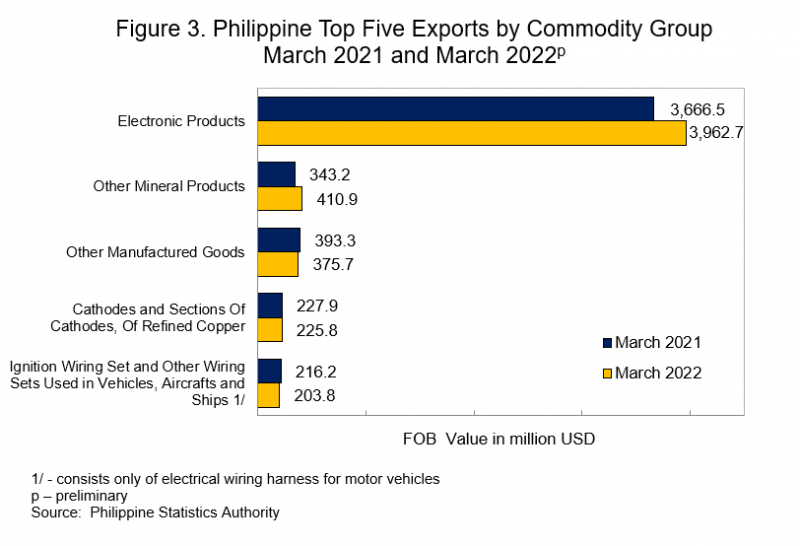
3. Electronic products commodity group remained the highest on export sales
By commodity group, electronic products continued to be the country’s top export in March 2022 with total earnings of USD 3.96 billion. This amount accounted for 55.3 percent of the total exports during the period. This was followed by other mineral products with an export value of USD 410.86 million (5.7%); and other manufactured goods which amounted to USD 375.68 million (5.2%). (Figure 3 and Table 3)
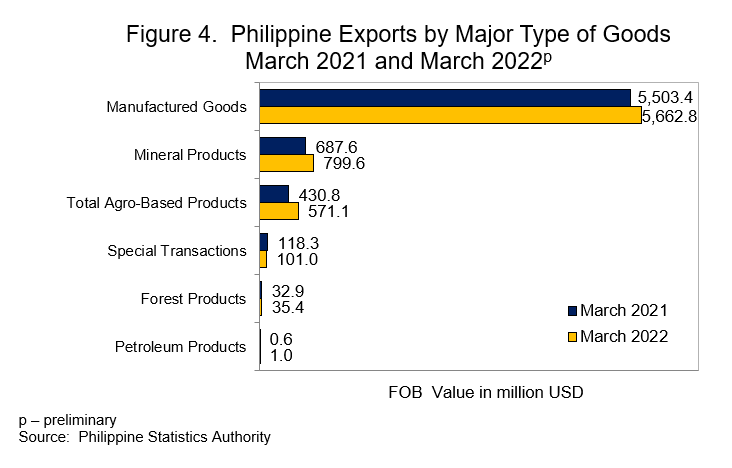
4. Manufactured goods still comprised the biggest chunk of total exports among major type of goods
By major type of goods, exports of manufactured goods shared the biggest to the total exports in March 2022 amounting to USD 5.66 billion (79.0%). This was followed by mineral products with a share of USD 799.60 million (11.2%); and total agro-based products which contributed USD 571.12 million (8.0%). (Figure 4 and Table 5)
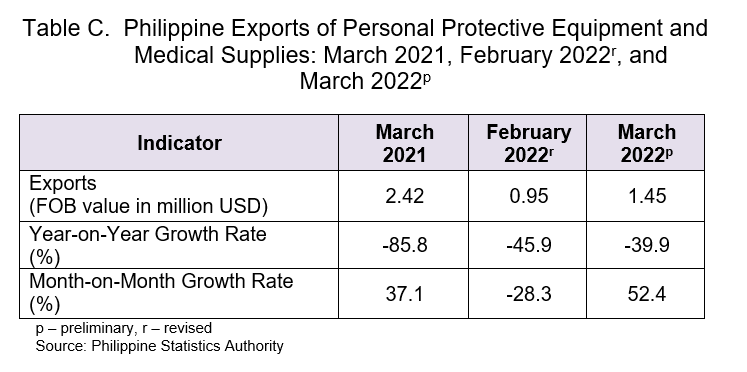
5. Total export value of Personal Protective Equipment (PPE) and medical supplies decreased in March 2022
The total export value for Personal Protective Equipment (PPE) and medical supplies in March 2022 dropped to USD 1.45 million. This represents an annual decrease of -39.9 percent from its value in March 2021. The annual decrease in the export value for these medical items in the previous month was recorded at -45.9 percent, while in March 2021, it declined by -85.8 percent.
The annual decreases in export for other face mask (non-surgical/non-medical masks including masks made of cloth) at -34.1 percent and surgical face mask at -33.2 percent contributed to the downtrend of export value for PPE and medical supplies in March 2022.
Month-on-month, export value for PPE and medical supplies increased by 52.4 percent in March 2022, while in February 2022, it declined by -28.3 percent.
Contributing to the monthly increment in the export value of PPE and medical supplies were the increases in the export value of surgical face mask (115.7%) and other face mask (non-surgical/non-medical masks including masks made of cloth, 33.5%). (Tables C and 7)
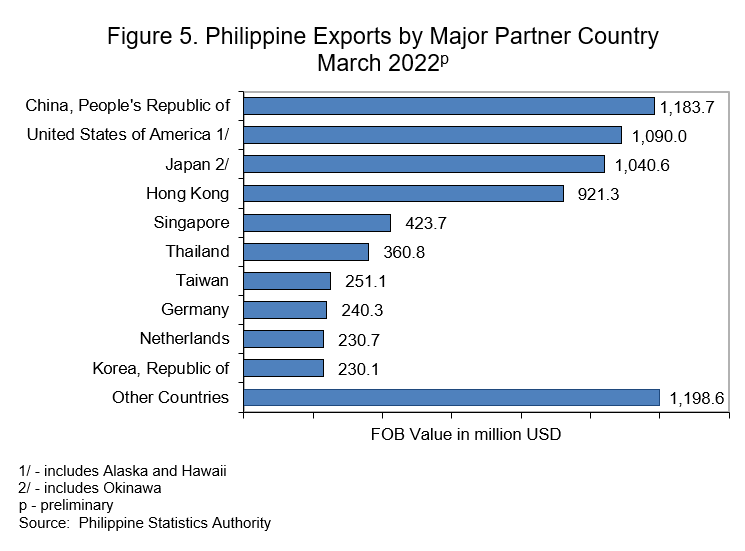
6. People’s Republic of China contributed the highest export value
By major trading partner, exports to the People’s Republic of China comprised the highest export value amounting to USD 1.18 billion or a share of 16.5 percent to the total exports during the month.
Completing the top five major export trading partners with their export values and percent shares to the total exports were:
a. United States of America (USA), USD 1.09 billion (15.2%);
b. Japan, USD 1.04 billion (14.5%);
c. Hong Kong, USD 921.27 million (12.8%); and
d. Singapore, USD 423.67 million (5.9%). (Figure 5 and Table 8)
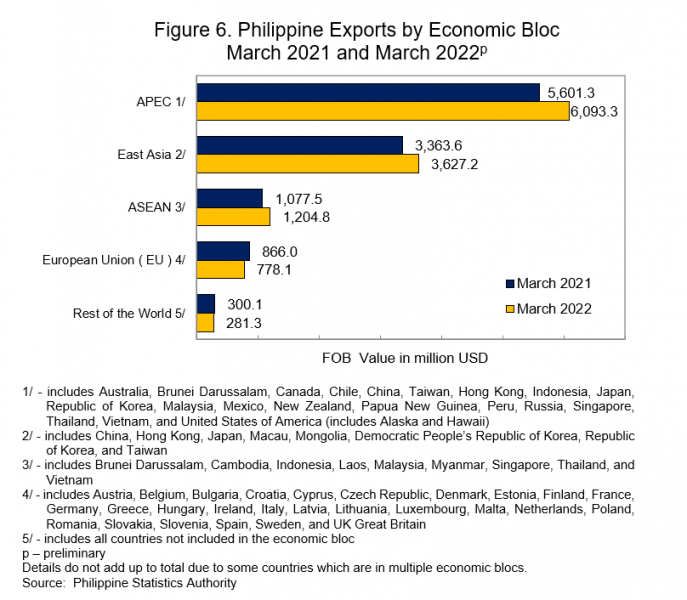
7. Majority of exports were for APEC countries
By economic bloc, majority of the country’s merchandise exports in March 2022 went to the Asia-Pacific Economic Cooperation (APEC) member countries with a share of USD 6.09 billion (85.0%) to total exports. This was followed by East Asia, valued at USD 3.63 billion (50.6%), and the Association of Southeast Asian Nations (ASEAN) at USD 1.20 billion (16.8%). (Figure 6 and Table 9)
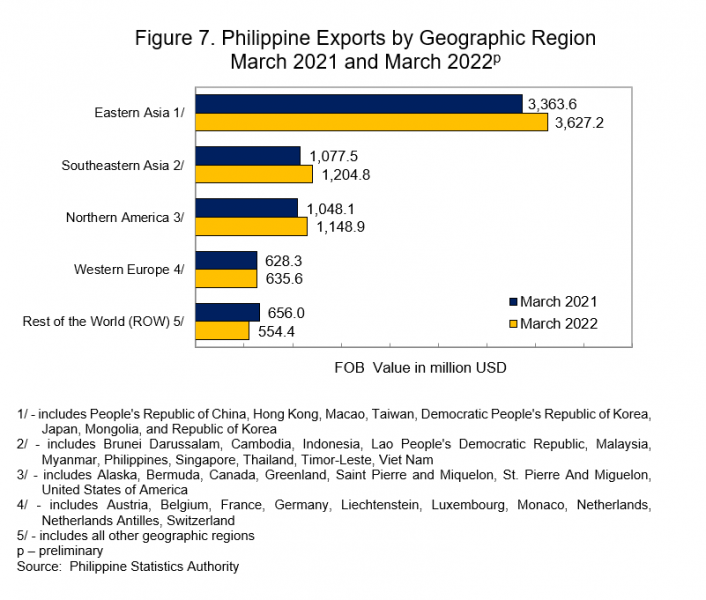
8. Eastern Asia contributed the highest export value by geographic region
By geographic region, Eastern Asia comprised the highest export value amounting to USD 3.63 billion in March 2022. This was followed by Southeastern Asia with an export value of USD 1.20 billion and Northern America with USD 1.15 billion worth of export value. (Figure 7 and Table 19)
C. IMPORTS
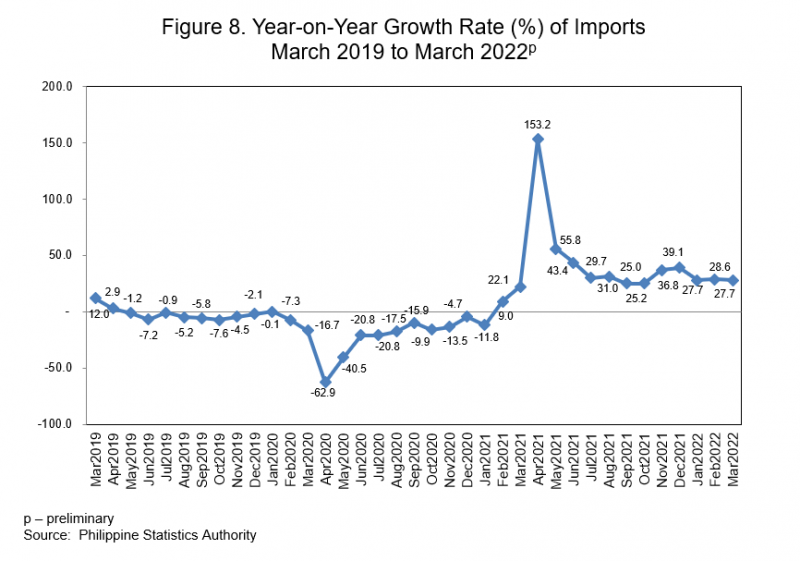
1. Import value increased
Total imported goods in March 2022, which amounted to USD 12.17 billion, increased at an annual rate of 27.7 percent. In February 2022, the annual increase was higher at 28.6 percent, while in March 2021, imports value grew by 22.1 percent annually. (Figures 1 and 8, and Tables A and 2)
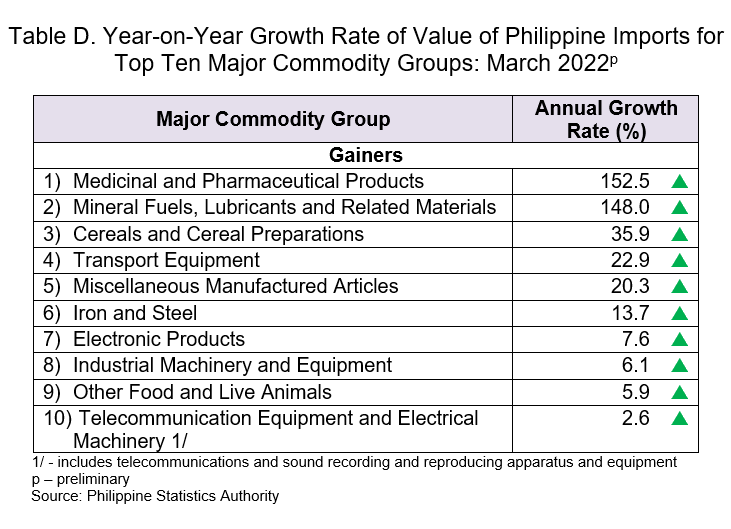
The annual increment of imported goods in March 2022 was due to the increase in all of the top 10 major commodity groups which was led by medicinal and pharmaceutical products with 152.5 percent annual increase. This was followed by mineral fuels, lubricants and related materials which rose by 148.0 percent annually; and cereals and cereal preparations, 35.9 percent. (Tables D and 10)
2. Year-to-date annual total import value grew
The year-to-date annual total import value, that is from January 2022 to March 2022, amounted to USD 33.31 billion. This represents an annual increment of 28.0 percent from the year-to-date annual total import value of USD 26.02 billion in January 2021 to March 2021. (Table 11)
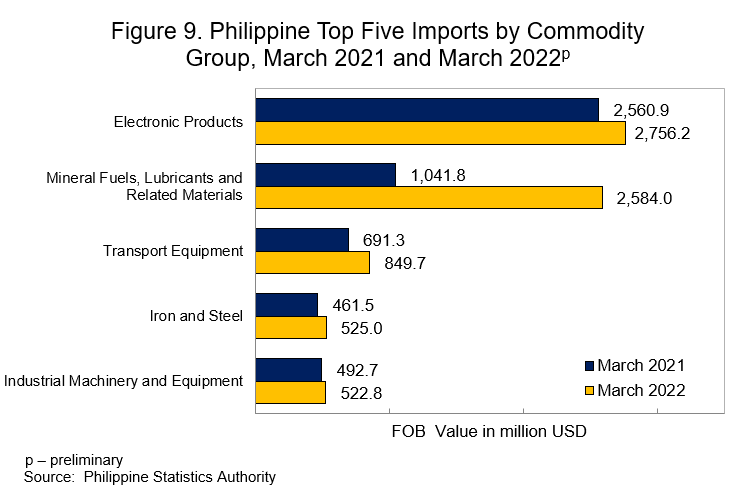
3. Electronic products accounted for the highest import value among commodity groups
Most of the imported goods were electronic products with an import value of USD 2.76 billion or a share of 22.6 percent to the total imports in March 2022. This was followed by mineral fuels, lubricants and related materials, valued at USD 2.58 billion (21.2%); and transport equipment which amounted to USD 849.74 million (7.0%). (Figure 9 and Table 10)
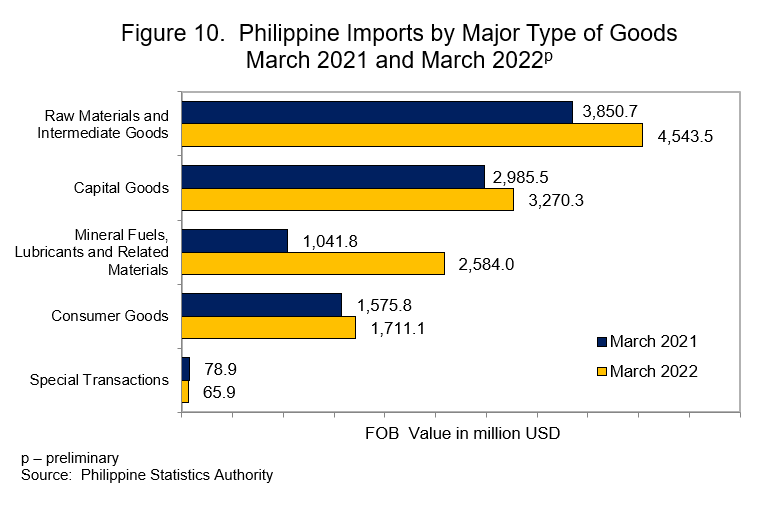
4. Imports of raw materials and intermediate goods contributed the highest among types of goods
By major type of goods, imports of raw materials and intermediate goods accounted for the largest share to the total imports amounting to USD 4.54 billion (37.3%) in March 2022. Imports of capital goods ranked second with a share of USD 3.27 billion (26.9%), followed by mineral fuels, lubricants and related materials with USD 2.58 billion (21.2%).
Imports of mineral fuels, lubricants and related materials recorded a positive annual growth of 148.0 percent from its value in the same month of the previous year. Contributing to the annual increment in this commodity group was the increase in the import value of petroleum products used to run motor vehicles (includes diesel fuel and fuel oils, light oils and preparations, and aviation turbine fuel) with a value of USD 1.81 billion. (Figure 10 and Table 12)
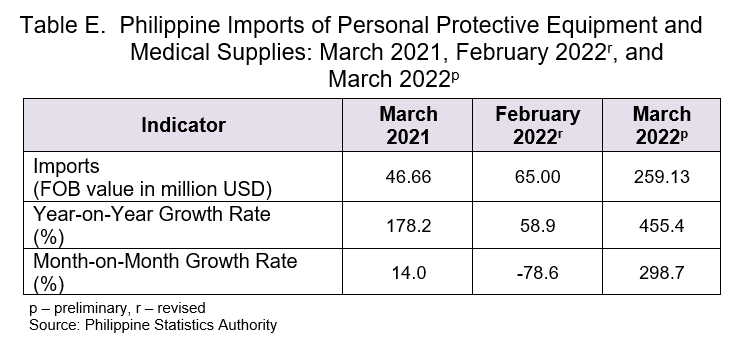
5. Total import value of Personal Protective Equipment (PPE) and medical supplies including COVID-19 vaccine increased in March 2022
The total import value for Personal Protective Equipment (PPE) and medical supplies, including Coronavirus disease 2019 (COVID-19) vaccine, increased to USD 259.13 million in March 2022, indicating an annual increment of 455.4 percent from its value in the same month of the previous year.
In March 2022, the total import for COVID-19 vaccine was valued at USD 242.99 million.
Annual growth rate of import value for PPE and medical supplies, including COVID-19 vaccine, was recorded at 58.9 percent in February 2022, while in March 2021, the annual increase was higher at 178.2 percent.
The annual increments noted in the following items have increased the total import value for PPE and medical supplies, including COVID-19 vaccine in March 2022:
a. COVID-19 vaccine (1,635.6%);
b. safety headgear (378.1%);
c. other face mask (non-surgical/non-medical masks including masks made of cloth, 19.2%); and
d. surgical gloves (0.1%).
Meanwhile, import value decreased year-on-year for face shield (-98.4%), protective clothing (-97.2%), surgical face mask (-88.2%), and testing kits (-56.5%)
Month-on-month, import value for PPE and medical supplies, including COVID-19 vaccine, increased by 298.7 percent in March 2022, while it registered a decline of -78.6 percent in the previous month.
Contributing to the monthly increment in the import value of PPE and medical supplies in March 2022, including COVID-19 vaccine, were the increases in the imports of COVID-19 vaccine (498.4%) and surgical gloves (173.6%).
On the other hand, import value declined month-on-month for the following:
a. face shield (-93.6%);
b. testing kits (-42.0%);
c. surgical face mask (-36.7%);
d. protective clothing (-36.6%);
e. other face mask (non-surgical/non-medical masks including masks made of cloth, -26.2%); and
f. safety headgear (-5.7%). (Tables E and 14).
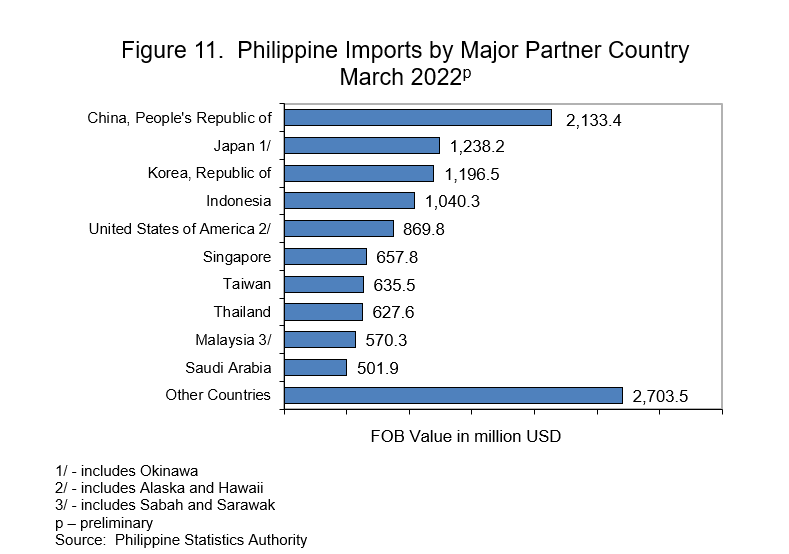
6. People’s Republic of China had the highest import value
The People’s Republic of China was the country’s biggest supplier of imported goods valued at USD 2.13 billion or 17.5 percent of the total imports in March 2022.
Completing the top five major import trading partners with their corresponding import values and percent shares to the total imports were:
a. Japan, USD 1.24 billion (10.2%);
b. Republic of Korea, USD 1.20 billion (9.8%);
c. Indonesia, USD 1.04 billion (8.5%); and
d. USA, USD 869.84 million (7.1%).
(Figure 11 and Table 15)
7. Imports came largely from APEC member countries
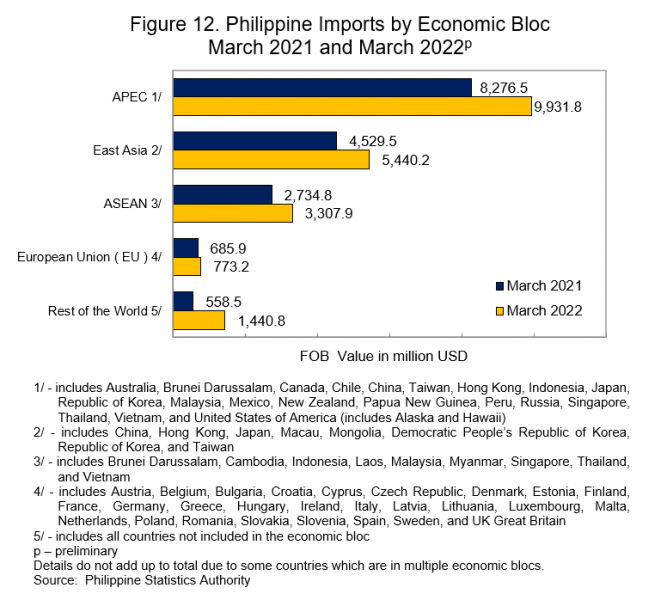
By economic bloc, APEC member countries were the biggest suppliers of the country’s imported goods in March 2022 with a share of USD 9.93 billion (81.6%). This was followed by East Asia with an import value of USD 5.44 billion (44.7%), and ASEAN with USD 3.31 billion (27.2%). (Figure 12 and Table 16)
8. Eastern Asia contributed the highest import value by geographic region
By geographic region, USD 5.44 billion of the country’s imports in March 2022 were from Eastern Asia. This was followed by Southeastern Asia whose import value amounted to USD 3.31 billion and Western Asia valued at USD 1.02 billion. (Figure 13 and Table 19)

DENNIS S. MAPA, Ph.D.
Undersecretary
National Statistician and Civil Registrar General
See more at the Philippine Export and Import Statistics main page.
Explanatory Notes
Export and import trade statistics are compiled by the Philippine Statistics Authority (PSA) from export and import documents submitted to the Bureau of Customs (BOC) by exporters and importers or their authorized representatives as required by law.
The following are documents collected, either in electronic or hard copies:
1. Export Declaration (ED – DTI form);
2. Informal Import Declaration and Entry (BOC Form 177); and
3. Single Administrative Documents (SAD) for Export Declaration (ED) and Import Entry and Internal Revenue Declaration (IEIRD).
The electronic copies of all documents that pass thru the online system are provided by BOC, Philippine Economic Zone Authority (PEZA), and Value Added Service Providers (VASPs) to PSA on a monthly basis through email and via shared Google Drive.
The electronic copies of the Export Declarations (SAD-ED) from the Automated Export Documentation System (AEDS) of the BOC are being utilized to generate export statistics. The AEDS is a paperless transaction in lieu of the manual filling up of export documents.
Moreover, an electronic copy of the Import Entry and Internal Revenue Declaration (SAD-IEIRD) is utilized to capture the monthly import figures. The SAD-IEIRD is an import document submitted online either by brokers or companies. These are transactions that pass through the Automated Cargo Operating System (ACOS), now called the e2m (electronic to mobile) customs system, which is implemented through the BOC e-Customs Project.
All documents (hard copies and electronic files) received within the cut-off date, which is every 25th day of the month, are compiled, processed, summarized, analyzed, and disseminated through monthly statistical tables and press releases (PRs). Processing includes coding, editing, reviewing, and validating of results.
Preliminary results of export and import statistics are disseminated in the form of press release (PR). The PR is disseminated every 40th day after the reference month. However, if the 40th day falls on a Saturday, the release is made a day earlier (Friday). If it falls on a Sunday or Monday, the release is on Tuesday. Moreover, if the release date falls on a holiday, the date of release is moved accordingly. Preliminary results are posted on the PSA website (www.psa.gov.ph).
All documents received after the cut-off date are included in the generation of the revised results. The revised data of the previous month are reported during the release of the preliminary report of the current month. Revisions are made for the previous months until the annual report is released three months after the reference year.
The 2019 Philippine Standard Commodity Classification (PSCC) is used to classify the commodities at 10-digit code level for statistical purposes.
Data requests on export and import statistics can be made at the PSA, Economic Sector Statistics Service, Trade Statistics Division with telephone number (02) 8376-1975 or email address j.soliven@psa.gov.ph.
| Attachment | Size |
|---|---|
|
|
890.75 KB |
|
|
138.83 KB |