
A. TOTAL EXTERNAL TRADE AND BALANCE OF TRADE
1. Total external trade decreased
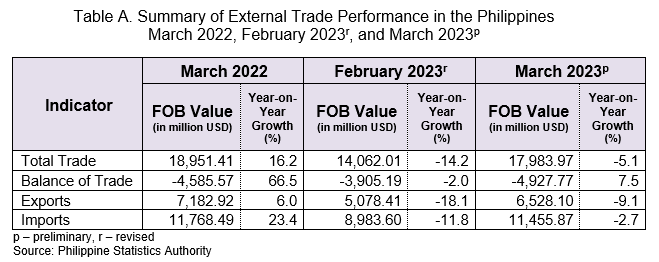
In March 2023, the country’s total external trade in goods amounted to USD 17.98 billion, which indicates an annual decline of -5.1 percent from its level of USD 18.95 billion in the same period of the previous year. In February 2023, its annual decrease was recorded at -14.2 percent, while in March 2022, it expanded at an annual rate of 16.2 percent. (Figure 1, and Tables A, 1, and 2)
Of the total external trade in March 2023, 63.7 percent were imported goods, while the rest were exported goods.
2. Trade deficit posted an annual decline
The balance of trade in goods (BoT-G) is the difference between the value of export and import. The BoT-G in March 2023 amounted to USD -4.93 billion, indicating a trade deficit with an annual increase of 7.5 percent. In February 2023, the trade deficit recorded an annual decline of -2.0 percent and in March 2022, it posted an annual increase of 66.5 percent. (Figure 1, and Tables A, 1, and 2)

B. EXPORTS
1. Sales from export posted a negative growth
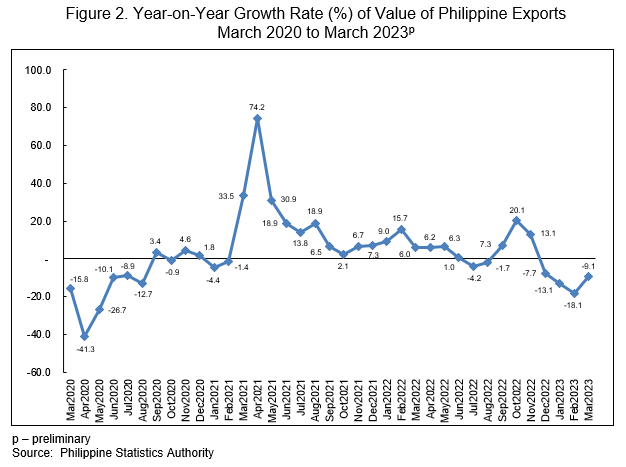
The country’s total export sales in March 2023 amounted to USD 6.53 billion, reflecting a slower decrease at an annual rate of -9.1 percent from a decrement of -18.1 percent in the previous month. In March 2022, the total export sales grew at an annual rate of 6.0 percent. (Figures 1 and 2, and Tables A, 1, and 2)
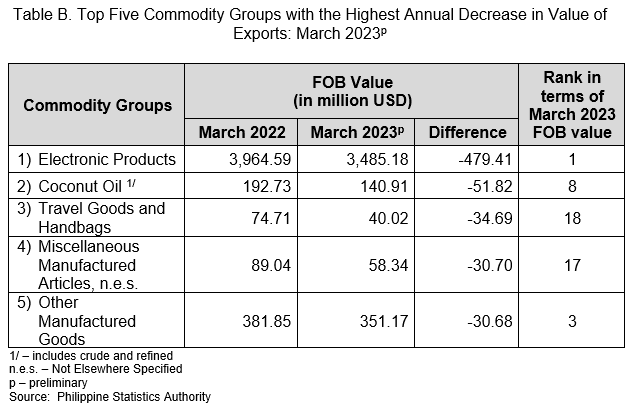
The commodity group with the highest annual decline in the value of exports in March 2023 was electronic products, which dropped by USD -479.41 million. This was followed by coconut oil, which decreased by USD -51.82 million; and travel goods and handbags by USD -34.69 million. (Tables B and 3)
2. Year-to-date annual total export decreased
The year-to-date annual total export earnings, that is from January to March 2023, amounted to USD 16.86 billion. This represents an annual decrease of -13.2 percent from the year-to-date annual total export value of USD 19.43 billion in January to March 2022. (Table 4)
3. Electronic products commodity group remained the highest on export sales
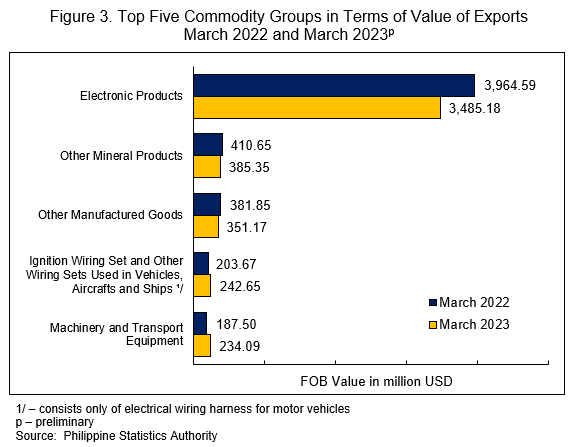
By commodity group, electronic products continued to be the country’s top export in March 2023 with total earnings of USD 3.49 billion or 53.4 percent of the country’s total exports during the period. This was followed by other mineral products with an export value of USD 385.35 million (5.9%); and other manufactured goods, which amounted to USD 351.17 million (5.4%). (Figure 3 and Table 3)
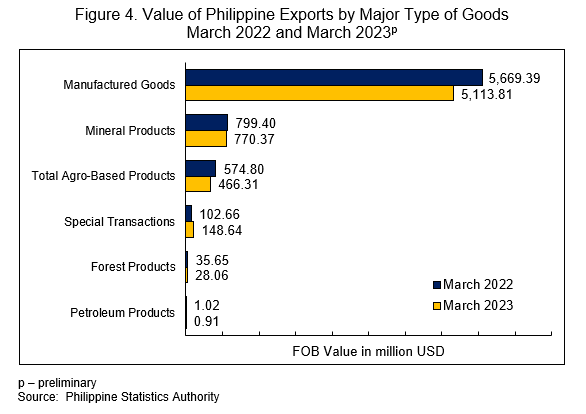
4. Manufactured goods still comprised the largest portion of total exports among major types of goods
By major type of goods, exports of manufactured goods contributed the largest to the country’s total exports in March 2023 amounting to USD 5.11 billion (78.3%). This was followed by mineral products with a share of USD 770.37 million (11.8%); and total agro-based products, which contributed USD 466.31 million (7.1%). (Figure 4 and Table 5)
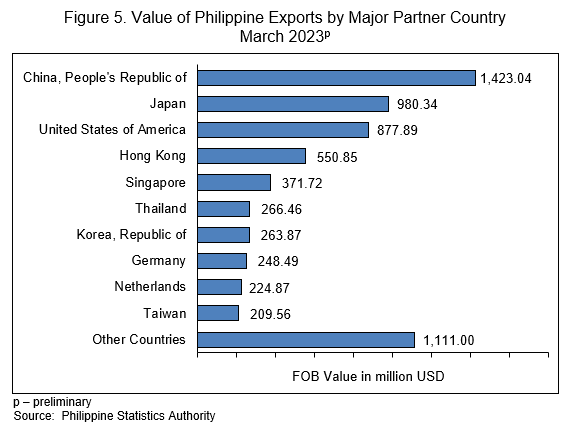
5. People’s Republic of China contributed the highest to the total export value
By major trading partner, exports to People’s Republic of China comprised the highest export value amounting to USD 1.42 billion or a share of 21.8 percent to the country’s total exports during the month.
Completing the top five major export trading partners in March 2023 with their export values and percent shares to the total exports were:
a) Japan, USD 980.34 million (15.0%);
b) United States of America (USA), USD 877.89 million (13.4%);
c) Hong Kong, USD 550.85 million (8.4%); and
d) Singapore, USD 371.72 million (5.7%). (Figure 5 and Table 7)
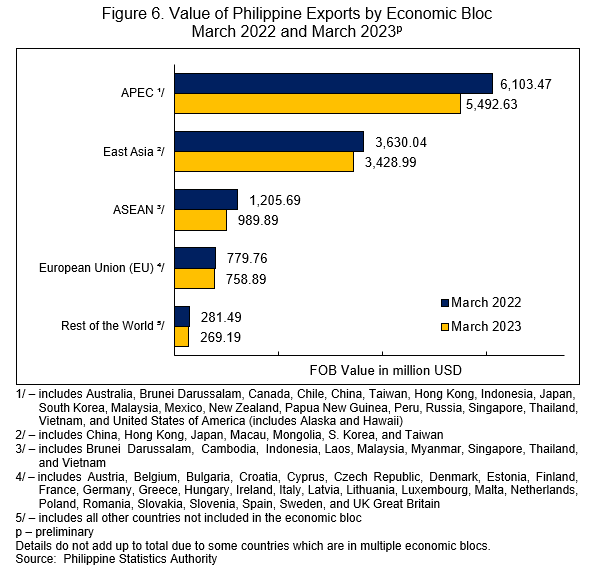
6. Majority of exports were for Asia-Pacific Economic Cooperation (APEC) countries
By economic bloc, majority of the country’s merchandise exports in March 2023 went to the APEC countries with a share of USD 5.49 billion (84.1%) to the country’s total exports. This was followed by East Asia, valued at USD 3.43 billion (52.5%), and the Association of Southeast Asian Nations (ASEAN) at USD 989.89 million (15.2%). (Figure 6, and Tables 8 and 16)
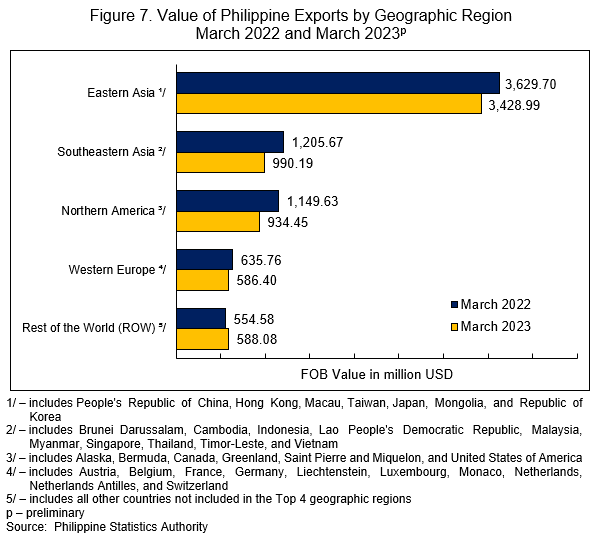
7. Eastern Asia contributed the highest export value by geographic region
By geographic region, Eastern Asia comprised the highest export value in March 2023 amounting to USD 3.43 billion (52.5%). This was followed by Southeastern Asia with an export value of USD 990.19 million (15.2%) and Northern America with USD 934.45 million (14.3%) worth of export value. (Figure 7 and Table 17)
C. IMPORTS
1. Import value decreased in March 2023
The total imported goods in March 2023 amounted to USD 11.46 billion, indicating an annual decrease of -2.7 percent. In February 2023, it recorded an annual decrease of -11.8 percent, while in March 2022, it exhibited a double-digit annual increase of 23.4 percent. (Figures 1 and 8, and Tables A, 1, and 2)

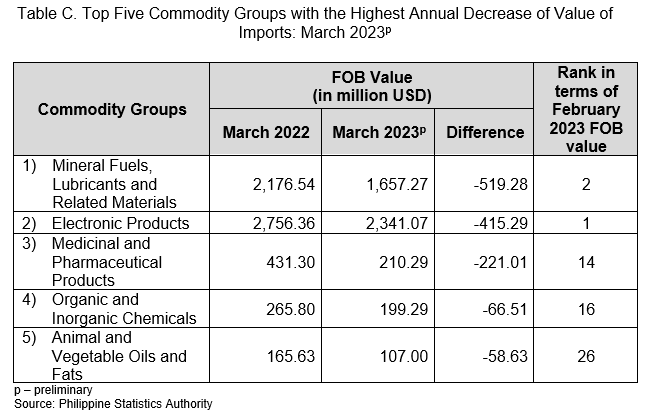
In March 2023, the commodity group with the highest decrement in the value of imported goods was mineral fuels, lubricants and related materials at USD -519.28 million. This was followed by electronic products, which declined by USD -415.29 million; and medicinal and pharmaceutical products by USD -221.01 million. (Tables C and 9)
2. Year-to-date annual total import value decreased
The year-to-date annual total import value, that is from January to March 2023, amounted to USD 31.44 billion. This represents an annual decrement of -3.3 percent from the total import value of USD 32.51 billion in January to March 2022. (Table 10)
3. Electronic products recorded the highest import value among commodity groups
The commodity group with the highest imported value in March 2023 was electronic products with an import value of USD 2.34 billion or a share of 20.4 percent to the country’s total imports. This was followed by mineral fuels, lubricants and related materials at USD 1.66 billion (14.5%); and transport equipment at USD 1.02 billion (8.9%). (Figure 9 and Table 9)

4. Imports of raw materials and intermediate goods contributed the highest among major types of goods
By major type of goods, imports of raw materials and intermediate goods accounted for the largest share to the country’s total imports in March 2023 amounting to USD 4.22 billion (36.9%). Imports of capital goods ranked second with a share of USD 3.29 billion (28.7%), followed by consumer goods with an import value of USD 2.25 billion (19.6%). (Figure 10 and Table 11)

5. People’s Republic of China had the highest import value
People’s Republic of China was the country’s biggest supplier of imported goods valued at USD 2.57 billion or 22.4 percent of the country’s total imports in March 2023.
Completing the top five major import trading partners for this month with their corresponding import values and percent shares to the total imports were:
a. Indonesia, USD 1.09 billion (9.5%);
b. Japan, USD 958.96 million (8.4%);
c. Republic of Korea, USD 780.55 million (6.8%); and
d. Thailand, USD 770.95 million (6.7%). (Figure 11 and Table 13)

6. Imports came largely from APEC member countries
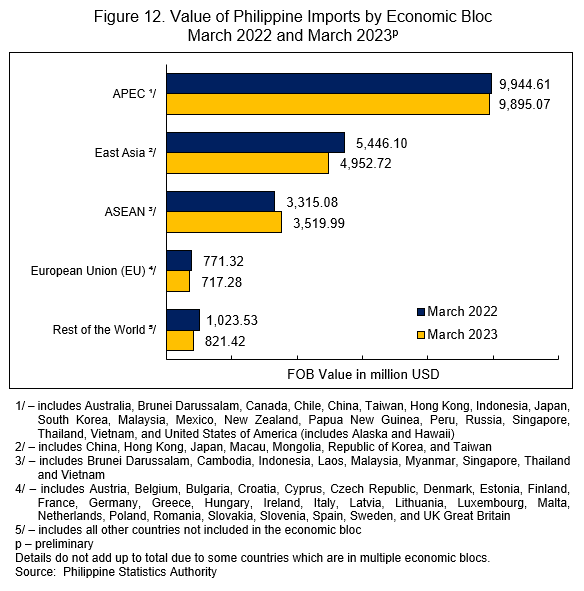
By economic bloc, APEC countries were the biggest suppliers of the country’s imported goods in March 2023 with a share of USD 9.90 billion (86.4%). This was followed by East Asia with an import value of USD 4.95 billion (43.2%), and ASEAN with USD 3.52 billion (30.7%). (Figure 12, and Tables 14 and 16)
7. Eastern Asia contributed the highest import value among geographic region
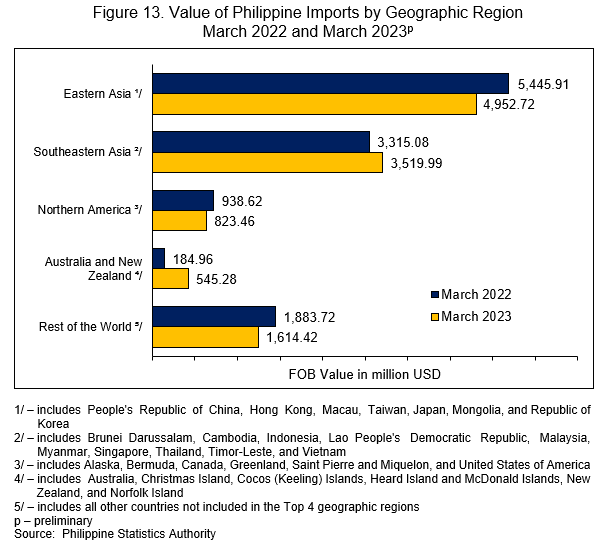
By geographic region, Eastern Asia had the highest import value of USD 4.95 billion (43.2%) in March 2023. This was followed by Southeastern Asia with an import value amounting to USD 3.52 billion (30.7%), and Northern America valued at USD 823.46 million (7.2%). (Figure 13 and Table 17)
CLAIRE DENNIS S. MAPA, Ph.D.
Undersecretary
National Statistician and Civil Registrar General
See more at the Foreign Trade - Export and Import landing page.
| Attachment | Size |
|---|---|
|
|
782.76 KB |
|
|
124.1 KB |
|
|
147.52 KB |