
TOTAL EXTERNAL TRADE IS $65.579 BILLION IN FIRST SEMESTER 2016
The country’s total external trade in goods in the First Semester 2016 reached $65.579 billion, expanding by 5.9 percent from $61.918 billion in 2015. The positive growth of the external trade was due to the increase of inward trading of goods. Total imports went up by 17.7 percent to $38.746 billion in 2016 from $32.917 billion in 2015. However, total export receipts decreased by 7.5 percent from $29.002 billion in 2015 to $26.832 billion in 2016. This brings the country’s balance of trade in goods (BoT-G) at $11.914 billion deficit in 2016 higher than the $3.915 billion deficit in 2015 (Table 1).

TOP 10 EXPORTS ACCOUNT FOR 83.5 PERCENT OF TOTAL EXPORT RECEIPTS
Export sales from the top ten exported commodities totaled to $22.404 billion, accounting for 83.5 percent of the total export revenue in the 1st semester of 2016. This registered a decrease of 5.1 percent from $23.600 billion in 2015 (Table 2).
Electronic Products continued to be the top earner and major exported commodity for 2016 sharing 50.7 percent of the total exports and slightly grew by 0.9 percent to $13.604 billion from $13.483 billion in 2015.
Other Manufactured Goods placed second with a share of 6.6 percent and a total receipt of $1.783 billion. It declined by 13.7 percent from the 2015 value of $2.067 billion.
Machinery and Transport Equipment contributing 6.5 percent of the total export receipts, was the third top export in 2016 with revenue amounting to $1.756 billion. This recorded a decrease of 9.9 percent from the 2015 value of $1.950 billion.
Woodcrafts and Furniture, which ranked fourth with a share of 6.2 percent, increased by 19.6 percent to $1.667 billion in 2016 from $1.393 billion.
Ignition Wiring Set and Other Wiring Sets Used in Vehicles, Aircrafts and Ships with share of 3.6 percent, ranked fifth with export receipts of $972.80 million. It decreased by 2.6 percent from the 2015 value of $999.00 million.
Rounding up the list of top ten exports for 2016 were: Chemicals with an export value of $711.57 million, decreased by 32.3 percent from $1.051 billion in 2015; Metal Components with proceeds billed at $551.69 million, went down by 14.8 percent from $647.37 million in 2015; Articles of Apparel, worth $524.47 million, dropped by 42.6 percent from $914.36 million; Coconut Oil with $419.93 million export receipts, decreased by 29.8 percent from $597.89 million; and Electronic Equipment and Parts, worth $414.24 million, declined by 16.7 percent from $497.13 million export receipts in 2015.

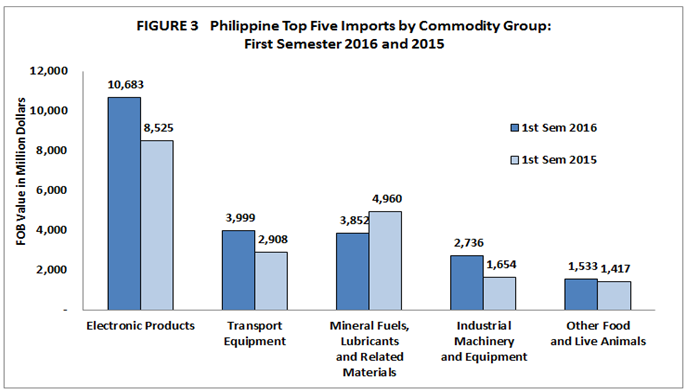
TOP 10 IMPORTS ACCOUNT FOR 73.0 PERCENT OF IMPORT BILL
Total payment for the country’s top ten imports for 2016 reached $28.277 billion or 73.0 percent of the total import payment, registering a positive growth of 20.0 percent from $23.558 billion in 2015 (Table 3).
Electronic Products remained as the top imported commodities for 2016, accounting for 27.6 percent of the total import bill. It posted an increase of 25.3 percent to $10.683 billion in 2016 from $8.525 billion in 2015.
Transport Equipment ranked second with 10.3 percent share and increased by 37.5 percent to $3.999 billion in 2016 from $2.908 billion in 2015.
Mineral Fuels, Lubricants and Related Materials which ranked third, comprised 9.9 percent of the total imports, and fell by 22.3 percent from $4.960 billion in 2015 to $3.852 billion in 2016.
Industrial Machinery and Equipment, ranked fourth, recorded a 7.1 percent share and grew by 65.4 percent to $2.736 billion worth of imports from $1.654 billion recorded value in 2015.
Other Food and Live Animals ranked fifth with 4.0 percent share of the total imports worth $1.533 billion, higher by 8.2 percent from $1.417 billion in 2015.
Rounding up the list for the top ten imports for 2016 were: Iron and Steel, $1.507 billion, registering an increase of 16.9 percent; Miscellaneous Manufactured Articles, $1.092 billion, increased by 38.0 percent; Telecommunication Equipment, $1.088 billion, expanded by 66.5 percent; Plastics in Primary and Non-Primary Forms, $1.021 billion, went up by 31.8 percent; and Power Generating and Specialized Machines, $765.79 million or an increase of 30.9 percent.
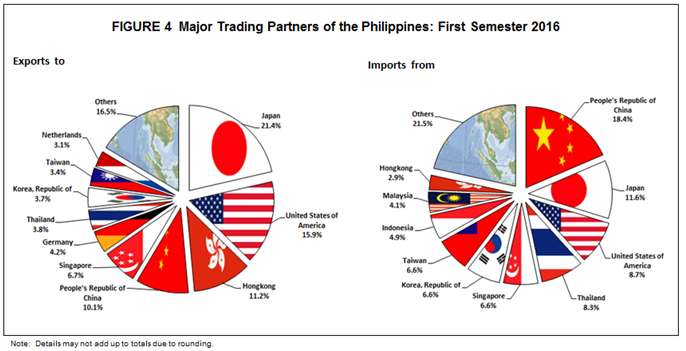
JAPAN ACCOUNTS FOR 15.6 PERCENT OF THE TOTAL TRADE
The country’s top 10 trading partners contributed a total trade worth $51.746 billion or 78.9 percent of the total external trade in 2016. This comprised a total export receipt of $21.313 billion or 79.4 percent of the total exports and total import bill of $30.433 billion or 78.5 percent of the total imports. This registered an unfavorable balance of trade-in goods (BOT-G) that amounted to $9.120 billion.
Japan was the country’s top trading partner in 2016, accounting for a total trade worth $10.225 billion or 15.6 percent of the country’s total trade. Exports to Japan totaled $5.748 billion while imports were valued at $4.477 billion, posting a trade surplus of $1.270 billion (Table 4). Woodcrafts and Furniture got a large share of 26.6 percent of the total exports to Japan valued at $1.529 billion, followed by Electronic Products at $1.513 billion or 26.3 percent (Table 5). On the other hand, majority of the imported products from Japan were Electronic Products billed at $1.311 billion or 29.3 percent and Industrial Machinery and Equipment with $698.64 million or 15.6 percent (Table 6).
People’s Republic of China was the country’s second largest trading partner in 2016 with total trade worth $9.816 billion or 15.0 percent of the total trade. Export receipts from China stood at $2.702 billion while payment for imports was valued at $7.114 billion, resulting to a $4.413 billion trade deficit (Table 4). Export-wise, the biggest sales came from Electronic Products at $1.629 billion or 60.3 percent of the country’s exports to China. Other Manufactured Goods followed with total receipts of $235.89 million or 8.7 percent (Table 5). Imported goods purchased from China consisted of Electronic Products worth $1.639 billion or 23.0 percent of the country’s total imports. Iron and Steel followed with imports of $1.047 billion or a share of 14.7 percent (Table 6).
United States of America placed third accounting for 11.6 percent or $7.626 billion total trade in 2016. Receipts from exports to USA were valued at $4.270 billion while payment for imports totaled to $3.357 billion, reflecting a trade surplus of $913.09 million (Table 4). Majority of the exports were Electronic Products worth $1.837 billion or 43.0 percent of the total exports to USA and Articles of Apparel and Clothing Accessories with $364.95 million or 8.5 percent share (Table 5). Major inward shipments from USA were Electronic Products with payment worth $1.381 billion or 41.1 percent of the total. Feeding Stuff for Animals (Not Including Unmilled Cereals) ranked second and valued at $354.09 million or 10.5 percent of the total (Table 6).
Singapore ranked as the fourth largest trading partner of the country for 2016 with a total trade amounting to $4.373 billion or a share of 6.7 percent to total trade. Total outward shipments were valued at $1.809 billion while import payments reached $2.564 billion, recording a trade deficit of $755.60 million (Table 4). Electronic Products and Petroleum Products were the country’s major exports to Singapore with earnings of $1.585 billion or
87.7 percent share and $34.92 million or 1.9 percent of the total exports, respectively (Table 5). The bulk of inward commodities from this country were Electronic Products with import bill of $1.178 billion or 45.9 percent share, and Mineral Fuels, Lubricants and Related Materials worth $294.56 million or 11.5 percent share (Table 6).
Thailand was the country’s fifth largest trading partner in 2016 with total trade worth $4.227 billion or 6.4 percent of the total external trade. Export revenues from this country stood at $1.020 billion while payment for imports was valued at $3.208 billion, resulting to a $2.188 billion trade deficit (Table 4). The major exported goods were Electronic Products at $469.62 million or 46.1 percent and Other Manufactured Goods with total receipts of $145.31 million or 14.3 percent of the country’s exports to Thailand (Table 5). However, the main imports from this country were Transport Equipment which worth $1.279 billion or 39.9 percent and Electronic Products with import payments valued at $527.04 million or 16.4 percent (Table 6).
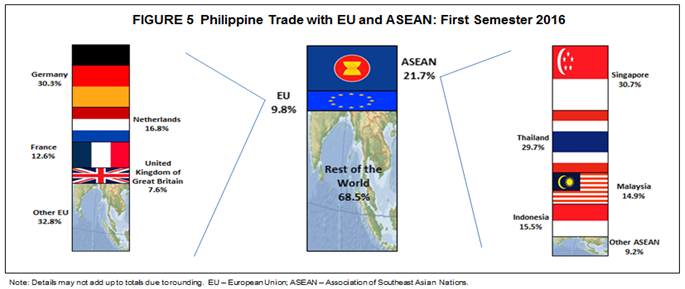
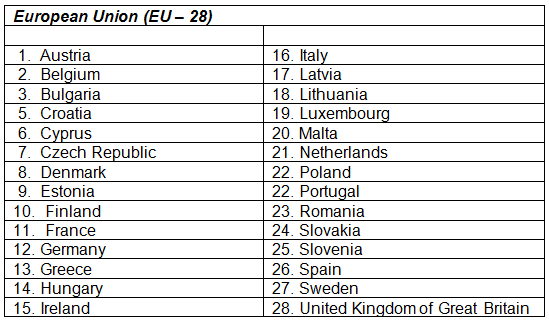
TRADING WITH EU MEMBER COUNTRIES IS AT 9.8 PERCENT OF TOTAL TRADE IN 2016
The country’s external trade in goods with the European Union (EU) member countries for 2016 totaled to $6.409 billion or 9.8 percent share of the total trade. Exports to EU reached $3.316 billion or 12.4 percent of the total export receipts, while imports were valued at $3.093 billion or an 8.0 percent share to total imports, resulting to a balance of trade in goods (BOT-G) surplus of $222.34 million. Among the EU member countries, Germany was the country’s top trading partner with a total trade of $1.942 billion or 30.3 percent of EU’s total trade. Revenue from exports to Germany amounted to $1.129 billion while payments for imports were worth $812.37 million or a trade surplus of $316.84 million (Table 7).
Major goods exported to the EU member countries in 2016 were: Electronic Products, $1.843 billion; Machinery and Transport Equipment, $472.02 million; Coconut Oil (crude and refined), $225.19 million; Other Manufactured Goods, $194.99 million; and Chemicals, $80.99 million (Table 8).
Top five imported goods from the EU member countries were: Electronic Products, $802.32 million; Transport Equipment, $337.61 million; Industrial Machinery and Equipment, $328.09 million; Medicinal and Pharmaceutical Products, $282.45 million; and Other Food and Live Animals, $212.52 million (Table 9).
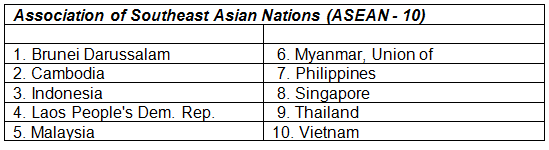
TOTAL TRADE WITH ASEAN MEMBER COUNTRIES POSTS AT $14.257 BILLION
Total external trade in goods with ASEAN member countries for 2016 amounted to $14.257 billion or 21.7 percent of the country’s entire trade. Exports to ASEAN member countries were valued at $4.043 billion while imports were worth $10.214 billion, generating a unfavorable balance of trade in goods (BoT-G) of $6.171 billion. Among the ASEAN countries, Singapore was the country’s top trading partner with a total trade accounting for $4.373 billion or 30.7 percent share of the ASEAN total trade. Exports to Singapore was worth $1.809 billion while imports payment was valued at $2.564 billion, reflecting a trade deficit of $755.60 million (Table 7).
Leading exports for the ASEAN member countries in 2016 were: Electronic Products, $2.642 billion; Other Manufactured Goods, $276.30 million; Chemicals, $189.81 million; Metal Components, $163.58 million; and Machinery and Transport Equipment, $153.52 million (Table 8).
Top five imported commodities from the ASEAN member countries were: Electronic Products, $2.418 billion; Transport Equipment, $2.068 billion; Mineral Fuels, Lubricants and Related Materials, $904.26 million; Other Food and Live Animals, $665.15 million; and Industrial Machinery and Equipment, $474.55 million (Table 9).
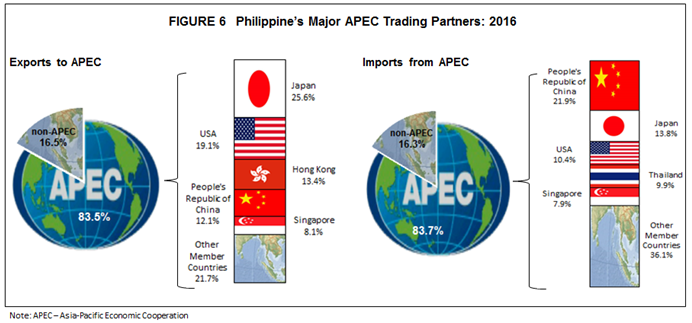
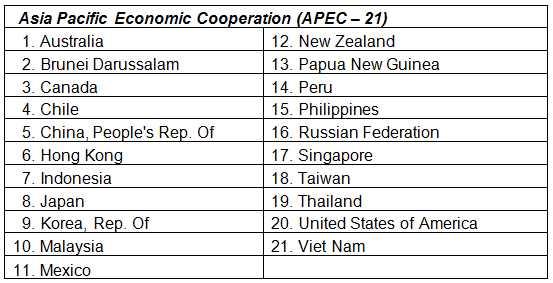
TOTAL TRADE WITH APEC MEMBER COUNTRIES REACHES $54.840 BILLION
Majority of the country’s external trade for 2016 were from APEC member countries which amounted to $54.840 billion or 83.6 percent of the country’s total trade. Export receipts totaled to $22.410 billion or 83.5 percent of the total exports while import payment summed up to $32.429 billion or 83.7 percent share of the total imports. Trading with this economic bloc resulted to an unfavorable balance of trade in goods (BOT-G) amounting to $10.019 billion. Topping the list of the country’s major trading partners within APEC were: Japan, $10.225 billion or 18.6 percent share; USA, $7.626 billion or 13.9 percent share; People’s Republic of China, $9.816 billion or 17.9 percent share; Singapore, $4.373 billion or 8.0 percent share; and Republic of Korea, $3.535 billion or 6.4 percent share of the APEC total trade (Table 10).
Electronic Products were still the country’s major export to APEC member countries in 2016 with sales valued at $11.556 billion or 51.6 percent share of the total APEC exports. Other top export commodities were: Woodcrafts and Furniture, $1.614 billion; Other Manufactured Goods, $1.502 billion; Machinery and Transport Equipment, $1.121 billion; and Ignition Wiring Set and Other Wiring Sets Used in Vehicles, Aircrafts and Ships, $955.70 million (Table 11).
The top imported goods from APEC member countries were: Electronic Products, $9.788 billion; Transport Equipment, $3.527 billion; Mineral Fuels, Lubricants and Related Materials, $2.356 billion; Industrial Machinery and Equipment, $2.293 billion; and Iron and Steel, $1.483 billion (Table 12).
Technical Notes
This is a semestral report and a summary of all monthly International Merchandise Trade Statistics of the Philippines for first semester of the year 2016 released by the Philippine Statistics Authority. The total exports stated in this special release are the summation of all monthly Merchandise Export Performance for the first semester of 2016, whereas, total imports are the consolidated monthly External Trade Performances in the country in the first semester of 2016.
The 2016 First Semester International Merchandise Trade Statistics for export and import figures are based on inclusions of late entries, i.e, documents received beyond 25th days after the reference month for exports and beyond 40th days after the reference month for imports.
The commodity groupings in this Special Release are in accordance with the 2004 Philippine Standard Commodity Classification (PSCC). The 2004 Philippine Standard Commodity Classification (PSCC) is used to classify the commodities at the 10-Digit level for statistical purposes. This is in compliance with the former NSCB Resolution No. 03, Series of 2005 entitled “Approving and Adopting the 2004 Philippine Standard Commodity Classification” by all concerned government agencies and instrumentalities.
All export transactions that pass through the Automated Export Documentation System (AEDS) and Electronic to Mobile (E2M) System are included in the compilation of International Merchandise Trade Statistics (IMTS). For transactions that did not pass through AEDS and E2M, the hardcopy of BOC documents are processed and included in the tabulation of data.
Starting with 2010 import statistics series, data are tabulated based on the transactions that pass through the Electronic to Mobile (E2M) System.
Import transactions that utilized Informal Import Declaration Entry Form (BC Form No. 177) are manually processed for inclusion in the tabulation. This document contains an importation of goods with dutiable value of PHP2,000 and below which comprised of personal and household effects.
Monthly IMTS are revised whenever import and export documents are received. Hence, semestral data are considered preliminary. The revised monthly data is disseminated on the next press release. Final monthly data are released through the annual compilation of trade statistics.
Statistical tables are also revised based on a new commodity classification. Whenever the new commodity classification is recommended for use, a parallel tabulation for the old and the new classifications are made available for six months so as to provide continuity of data series, after which, statistical tables will be based on the new classification.
Below are the compositions of countries in the all economic bloc mentioned in this Special Release:
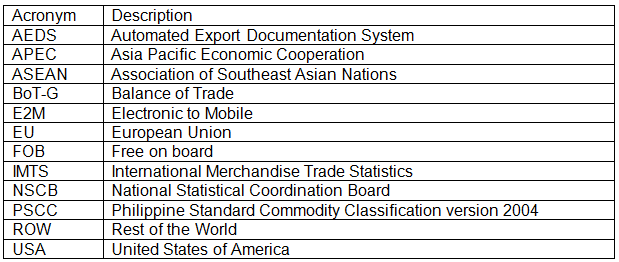
List of acronyms used in this Special Release:
| Attachment | Size |
|---|---|
|
|
365.4 KB |