Population of Batanes increased at the rate of 0.08 percent annually
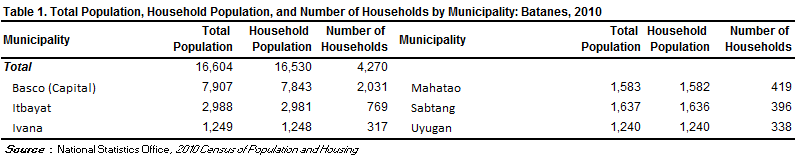
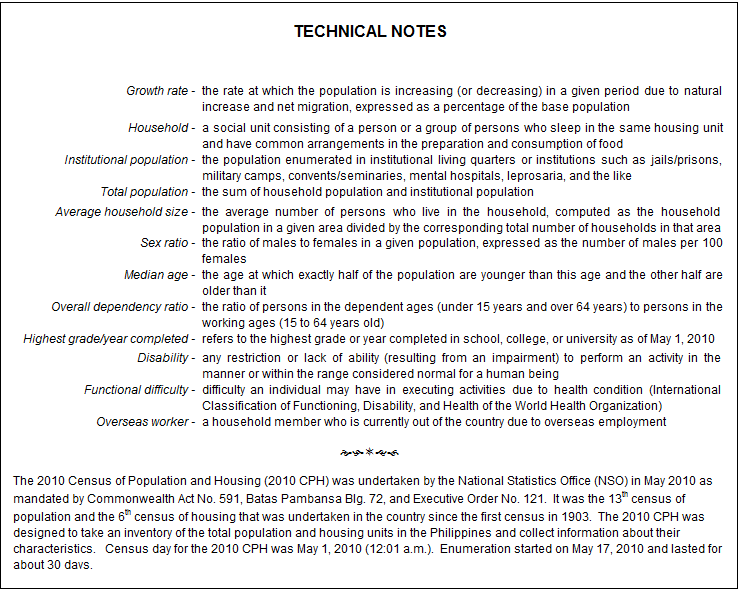
Based on the 2010 Census of Population and Housing (CPH), the province of Batanes posted a total population of 16,604 persons as of May 1, 2010. This is larger by 137 persons compared to its total population of 16,467 persons counted in the 2000 CPH. The increase in the population count from 2000 to 2010 translated to an average annual population growth rate (PGR) of 0.08 percent. This is lower than the 0.92 percent annual PGR of the province between the census years 1990 and 2000.
If the average annual PGR recorded at 0.08 percent during the period 2000 to 2010 continues, the population of Batanes would double in 845 years.
Fifty years ago, the population of Batanes was only 10,309 persons. This population size is less than two thirds of the population of the province in the 2010 CPH.
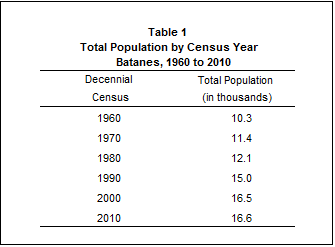
Basco was the most populous municipality
Among the six municipalities comprising the province of Batanes, the municipality of Basco, the provincial capital, was the most populous with a population making up 47.6 percent of the total provincial population. The municipality of Itbayat was second with 18.0 percent share. This was followed by the municipalities of Sabtang with 9.9 percent, Mahatao with 9.5 percent, Ivana with 7.5 percent, and Uyugan with 7.5 percent.
In 2000, the municipality of Uyugan was also the least populated municipality in Batanes.
Sex ratio was 101 males per 100 females
In 2010, the household population was 16,530 with males accounted for 50.3 percent while females comprised 49.7 percent. These figures resulted in a sex ratio of 101 males for every 100 females. The sex ratio recorded in 2000 was 105 males per 100 females.
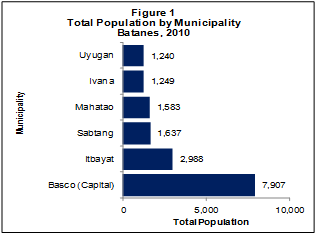
Median age increased to 26.3 years
In 2010, the median age of the population of the province was 26.3 years, which means that half of the population was younger than 26.3 years. This is higher than the median age of 23.3 years that was recorded in 2000.
Moreover, approximately one in every three persons (31.6 percent) was under 15 years old. Children aged 10 to 14 years (11.4 percent) comprised the largest age group, followed by those in the age groups 5 to 9 years (10.7 percent) and 0 to 4 years (9.6 percent). Males outnumbered females in the age groups 0 to 34 years, and 40 to 49 years. On the other hand, there were more females than males in the age groups 35 to 39 and 50 years and over.
More than half of the population were of voting age
The voting-age population (18 years and over) accounted for 62.6 percent of the household population of the province in 2010, up from 60.0 percent in 2000. There were more females (50.5 percent) than males (49.5 percent) among the voting-age population.
Dependency ratio decreased to 68 dependents per 100 persons in the working age group
In 2010, the young dependents (0 to 14 years) comprised 31.6 percent of the household population while the old dependents (65 years and over) posted a share of 8.8 percent. The working-age population (15 to 64 years) accounted for the remaining 59.5 percent.
The overall dependency ratio was 68, which indicates that for every 100 working-age population, there were about 68 dependents (53 young dependents and 15 old dependents). This ratio is lower than the dependency ratio in 2000, which was recorded at 70 dependents per 100 working-age population (57 young dependents and 13 old dependents).
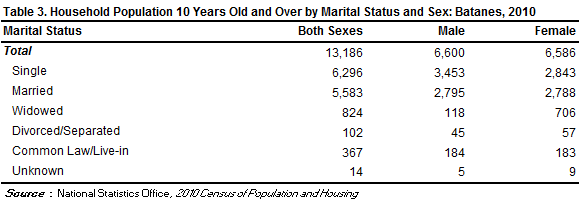
There were more males than females among the never-married persons
Of the household population 10 years old and over, 47.7 percent were never married while 42.3 percent were married. The rest of the population were categorized as follows: widowed (6.2 percent), in common-law/live-in marital arrangement (2.8 percent), and divorced/separated (0.8 percent).
Among the never-married persons, 54.8 percent were males while 45.2 percent were females. For the categories of widowed and divorced/separated, the females outnumbered the males.
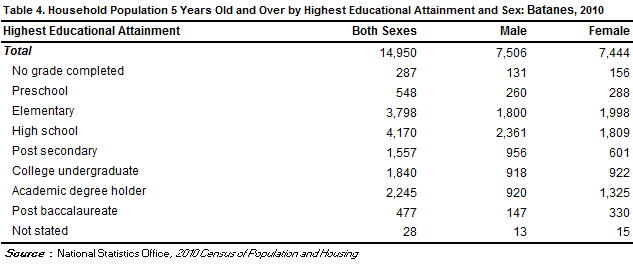
More females had attained higher levels of education
Of the household population aged five years and over, 25.4 percent had attended or completed elementary education, 27.9 percent had reached or finished high school, 10.4 percent were post secondary, 12.3 percent were college undergraduates, and 15.0 percent were academic degree holders. Among those with an academic degree, the females (59.0 percent) outnumbered the males (41.0 percent). Similarly, more females (69.2 percent) than males (30.8 percent) had pursued post baccalaureate courses.
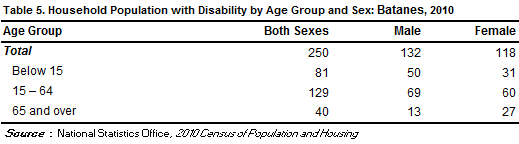
Persons with disability comprised 1.5 percent of the population in the province
In 2010, around 300 persons or 1.5 percent of the 16,530 household population had a disability. The proportion of persons with disability (PWD) in 2000 was 3.0 percent of the 16,421 household population of the province during that year. The number of PWD for the same year was around 500.
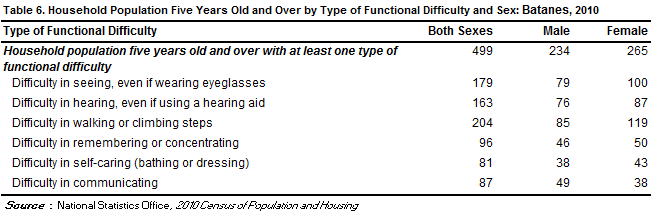
More females than males among those with functional difficulty
Of the 14,950 household population five years and over, 3.3 percent (or 499 persons) had at least one type of functional difficulty either in seeing, hearing, walking or climbing steps, remembering or concentrating, self-caring (bathing or dressing), or communicating. There were more females (53.1 percent) than males (46.9 percent) among those persons with at least one type of functional difficulty.
Moreover, of the total 499 persons aged five years and over with at least one type of functional difficulty, 40.9 percent reported difficulty in walking or climbing steps. There were 35.9 percent who had difficulty in seeing, even if wearing eyeglasses; 32.7 percent had difficulty in hearing, even if using a hearing aid; 19.2 percent had difficulty in remembering or concentrating; 17.4 percent had difficulty in communicating, and 16.2 percent had difficulty in self-caring (bathing or dressing).
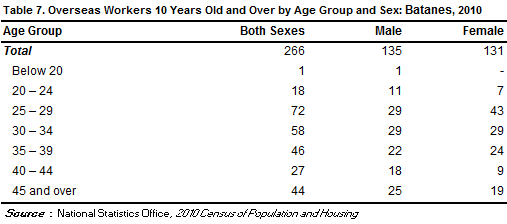
Male overseas workers outnumbered their female counterparts
Of the 13,186 household population 10 years old and over in Batanes, 2.0 percent (or 266 persons) were overseas workers. Male overseas workers outnumbered their female counterparts as they comprised 50.8 percent of all the overseas workers from this province. Overseas workers aged 25 to 29 years made up the largest age group, comprising 27.1 percent of the total overseas workers from this province in 2010, followed by the age groups 30 to 34 years (21.8 percent), 35 to 39 years (17.3 percent), and 45 years and over (16.5 percent).
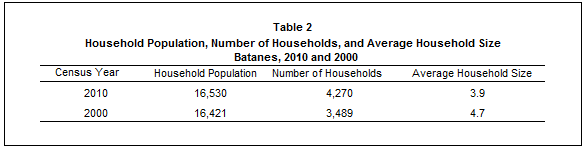
Average household size was 3.9 persons
The number of households in 2010 was recorded at 4,270, higher by 781 households compared with the 3,489 households posted in 2000. The average household size in 2010 was 3.9 persons, lower than the average household size of 4.7 persons in 2000.
There were 101 households per 100 occupied housing units
A total of 4,243 occupied housing units were recorded in the province of Batanes in 2010. This translates to a ratio of 101 households for every 100 occupied housing units, with 3.9 persons per occupied housing unit. In 2000, there were 101 households per 100 occupied housing units, and 4.8 persons per occupied housing unit.
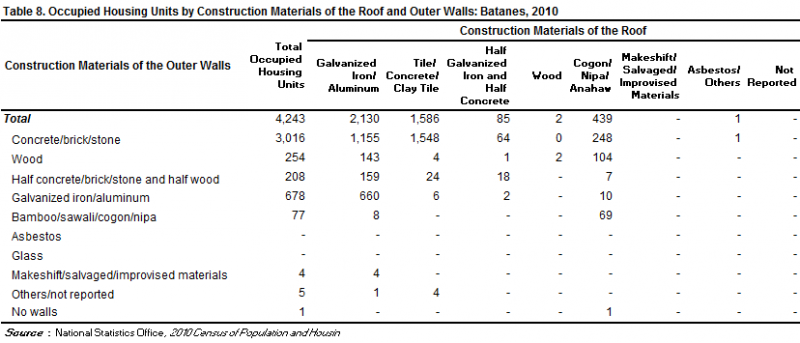
Occupied housing units with outer walls and roofs made of strong materials increased
In 2010, 71.1 percent of the occupied housing units in the province had outer walls made of concrete/brick/stone. The proportion of occupied housing units with outer walls made of galvanized iron/aluminum increased from 7.2 percent in 2000 to 16.0 percent in 2010. Those with walls made of wood decreased from 9.0 percent in 2000 to 6.0 percent in 2010. Meanwhile, 50.2 percent of the occupied housing units in 2010 had roofs made of galvanized iron/aluminum. This is higher than the proportion recorded in 2000 at 44.8 percent. Those with roofs made of tile/concrete/clay tile increased from 23.0 percent in 2000 to 37.4 percent in 2010.
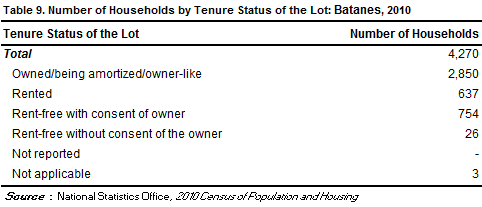
Two in every three households lived in lots that they owned or amortized
In 2010, of the total 4,270 households, 66.7 percent owned or amortized the lots that they occupied. The corresponding figure in 2000 was 64.8 percent.
Moreover, 17.7 of the households occupied lots which were rent-free but with consent of the owner, 14.9 percent rented the lots that they occupied while 0.6 percent occupied lots which were rent-free but without consent of the owner.