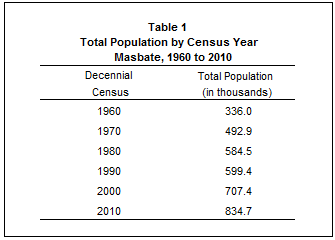
Population of Masbate increased at the rate of 1.66 percent annually
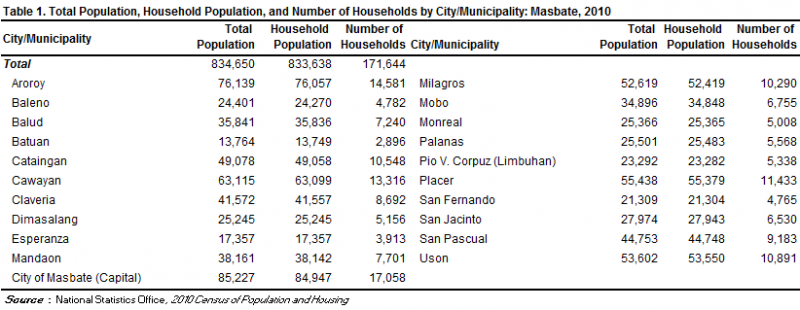
Based on the 2010 Census of Population and Housing (CPH), the province of Masbate posted a total population of 834,650 persons as of May 1, 2010. This is larger by 126,982 persons compared to its total population of 707,668 persons counted in the 2000 CPH. The inccrease in the population count from 2000 to 2010 translated to an average annual population growth rate (PGR) of 1.66 percent. This is lower than the 1.67 percent annual PGR of the province between the census years 1990 and 2000.
If the average annual PGR recorded at 1.66 percent during the period 2000 to 2010 continues, the population of Masbate would double in 42 years.
Fifty years ago, the population of Masbate was only 335,971 persons. This population size is about two fifth of the population of the province in the 2010 CPH.
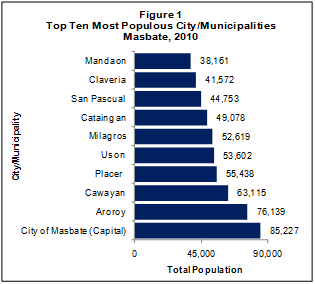
City of Masbate was the most populous
Among the lone city and 20 municipalities comprising the province of Masbate, the City of Masbate, the provincial capital, was the most populous with a population size making up 10.2 percent of the total provincial population. The municipality of Aroroy was second with 9.1 percent share, followed by the municipalities of Cawayan (7.6 percent), Placer (6.6 percent), Uson (6.4 percent), and Milagros (6.3 percent). The rest of the municipalities contributed less than 6.0 percent each.
The least populated area was the municipality of Batuan with 1.6 percent share to the total population of the province. It was also the least populated area in 2000.
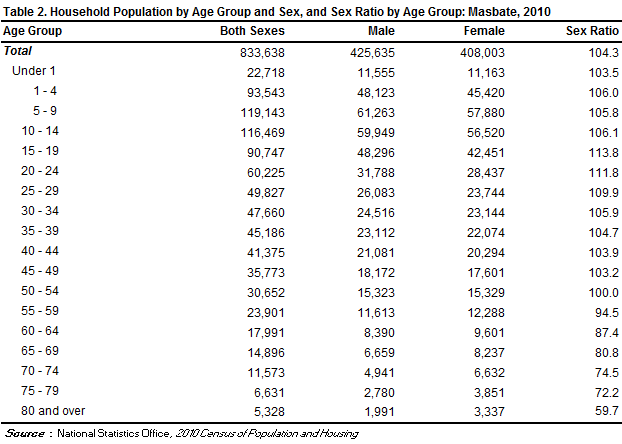
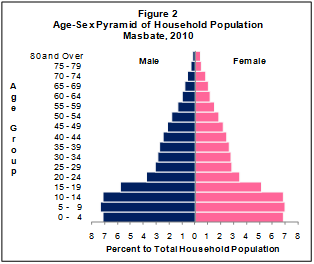
Sex ratio was 104 males per 100 females
Of the 833,638 household population in 2010, males accounted for 51.1 percent while females comprised 48.9 percent. These figures resulted in a sex ratio of 104 males for every 100 females, which is similar to the sex ratio recorded in 2000.
Median age increased to 18.6 years
In 2010, the median age of the population of the province was 18.6 years, which means that half of the population was younger than 18.6 years. This is higher than the median age of 18.1 years that was recorded in 2000.
Moreover, four in every 10 persons (42.2 percent) were under 15 years old. Children aged 5 to 9 years (14.3 percent) comprised the largest age group, followed closely by those in the age groups 10 to 14 years (14.0 percent) and 0 to 4 years (13.9 percent). Males outnumbered females in the age groups 0 to 49 years. On the other hand, there were more females than males in the older age groups (50 years and over).
Half of the population were of voting age
The voting-age population (18 years and over) accounted for 50.7 percent of the household population of the province in 2010, up from 49.8 percent in 2000. There were more males (50.5 percent) than females (49.5 percent) among the voting-age population.
Dependency ratio decreased to 88 dependents per 100 persons in the working age group
In 2010, the young dependents (0 to 14 years) comprised 42.2 percent of the household population while the old dependents (65 years and over) posted a share of 4.6 percent. The working-age population (15 to 64 years) accounted for the remaining 53.2 percent.
The overall dependency ratio was 88, which indicates that for every 100 working-age population, there were about 88 dependents (79 young dependents and nine old dependents). This ratio is lower than the dependency ratio in 2000, which was recorded at 93 dependents per 100 working-age population (85 young dependents and eight old dependents).
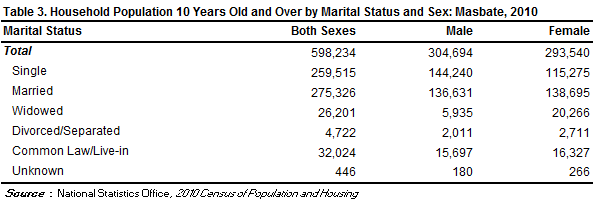
There were more males than females among the never-married persons
Of the household population 10 years old and over, 46.0 percent were married while 43.4 percent were never married. The rest of the population were categorized as follows: in common-law/live-in marital arrangement (5.4 percent), widowed (4.4 percent), and divorced/separated (0.8 percent).
Among the never-married persons, 55.6 percent were males while 44.4 percent were females. For the rest of the categories for marital status, the females outnumbered the males.
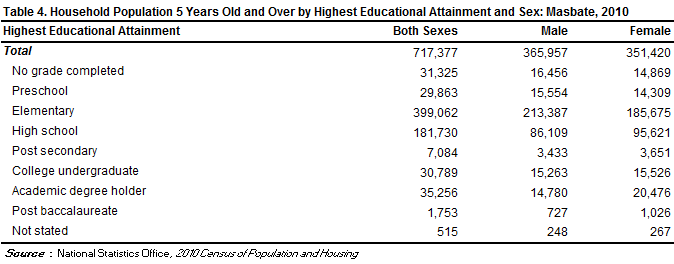
More females had attained higher levels of education
Of the household population aged five years and over, 55.6 percent had attended or completed elementary education, 25.3 percent had reached or finished high school, 4.3 percent were college undergraduates, and 4.9 percent were academic degree holders. Among those with an academic degree, the females (58.1 percent) outnumbered the males (41.9 percent). Similarly, more females (58.5 percent) than males (41.5 percent) had pursued post baccalaureate courses.
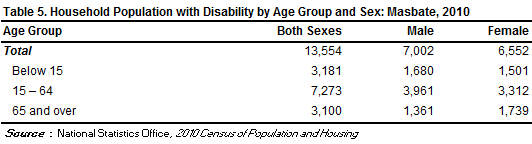
Persons with disability comprised 1.6 percent of the population in the province
In 2010, around 13,600 persons or 1.6 percent of the 833,638 household population had a disability. This proportion of persons with disability (PWD) is higher than the proportion in 2000, which was 1.2 percent of the 707,055 household population of the province during that year. The number of PWD for the same year was around 8,600.
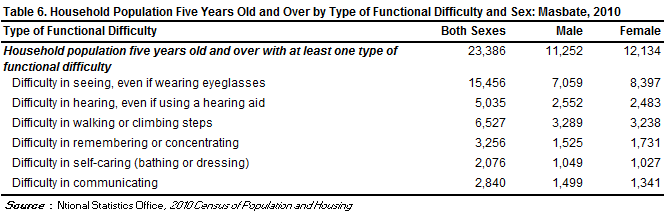
There were more females than males among those with functional difficulty
Of the 717,377 household population five years and over, 3.3 percent (23,386 persons) had at least one type of functional difficulty either in seeing, hearing, walking or climbing steps, remembering or concentrating, self-caring (bathing or dressing), or communicating. There were more females (51.9 percent) than males (48.1 percent) among those persons with at least one type of functional difficulty.
Moreover, of the total 23,386 persons aged five years and over with at least one type of functional difficulty, 66.1 percent reported difficulty in seeing, even if wearing eyeglasses. There were 27.9 percent who had difficulty in walking or climbing steps; 21.5 percent had difficulty in hearing, even if using a hearing aid; 13.9 percent had difficulty in remembering or concentrating; 12.1 percent had difficulty in communicating; and 8.9 percent had difficulty in self-caring (bathing or dressing).
Male overseas workers outnumbered their female counterparts
Of the 598,234 household population 10 years old and over in Masbate, 0.4 percent (or 2,363 persons) were overseas workers. Male overseas workers outnumbered their female counterparts as they comprised 59.6 percent of all overseas workers from this province. Overseas workers aged 45 years and over made up the largest age group, comprising 18.7 percent of the total overseas workers from this province in 2010, followed by the age groups 30 to 34 years (16.0 percent), 25 to 29 years (14.7 percent) and 35 to 39 years (14.1 percent).
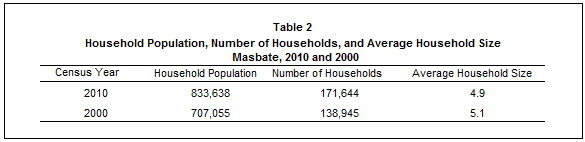
Average household size was 4.9 persons
The number of households in 2010 was recorded at 171,644, higher by 32,699 households compared with the 138,945 households posted in 2000. The average household size in 2010 was 4.9 persons, lower than the average household size of 5.1 persons in 2000.
There were 101 households per 100 occupied housing units
A total of 170,585 occupied housing units were recorded in Masbate in 2010. This translates to a ratio of 101 households for every 100 occupied housing units, with 4.9 persons per occupied housing unit. In 2000, there were 101 households per 100 occupied housing units and 5.1 persons per occupied housing unit.
Occupied housing units with outer walls and roofs made of light materials decreased
In 2010, four in every ten (42.4 percent) occupied housing units in the province had outer walls made of bamboo/sawali/cogon/nipa, down from 50.0 percent in 2000. The proportion of occupied housing units with outer walls made of wood decreased from 22.4 percent in 2000 to 21.1 percent in 2010. Those with walls made of concrete/brick/stone increased from 11.5 percent to 20.4 percent. Meanwhile, majority (49.4 percent) of the occupied housing units in 2010 had roofs made of cogon/nipa/anahaw. This is lower than the proportion recorded in 2000 at 68.3 percent.
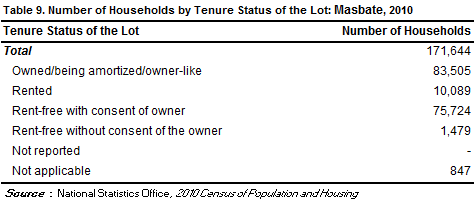
Majority of the households lived in lots that they owned or amortized
In 2010, of the total 171,644 households, 48.7 percent owned or amortized the lots that they occupied. The corresponding figure in 2000 was lower at 45.6 percent.
Moreover, 44.1 percent of the households occupied lots which were rent-free but with consent of the owner, 5.9 percent rented the lots that they occupied while 0.9 percent occupied lots which were rent-free but without consent of the owner.