
Merchandise Export Performance * December 2008
| |||||||||||||||||||||||||||||||||||||||||||||||
Top 10 Philippine Exports for All Countries: December 2008 p | |||
Gainers | Losers | ||
| Pineapple and Pineapple Products | 29.1 | Cathodes and Sections of Cathodes, of Refined Copper | -70.9 |
| Bananas | 9.4 | Electronic Products | -47.6 |
| Woodcrafts and Furniture | 7.4 | Ignition Wiring Set and Other Wiring Sets Used in Vehicles, Aircrafts and Ships | -45.6 |
| Other Products Manufactured from Materials Imported on Consignment Basis | 3.3 | Coconut Oil | -28.9 |
| Articles of Apparel and Clothing Accessories | -11.4 | ||
| Metal Components | -4.5 | |
|
| ||
p - preliminary
r - revised
DECEMBER 2008 MERCHANDISE EXPORTS FELL BY 40.4 PERCENT
Export earnings in December 2008 dropped by 40.4 percent to $2.672 billion from $4.482 billion in December 2007. The same was true with the previous month’s level, where a 23.9 percent decrease was noted from $3.513 billion. Similarly, receipts from merchandise exports during January to December 2008 declined by 2.9 percent to 49.023 billion from 50.466 billion during the 12-month period in 2007.
ELECTRONIC PRODUCTS DOWN BY 47.6 PERCENT
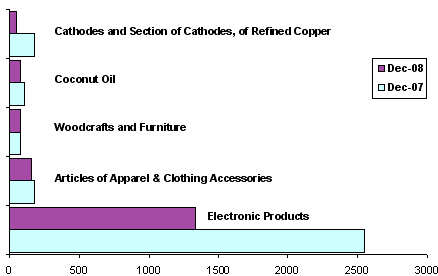
Accounting for 50.0 percent of the aggregate export revenue in December 2008, Electronic Products amounted to $1.335 billion. It declined by 47.6 percent from $2.547 billion in December 2007. Similarly, month-on-month, it decreased by 33.6 percent from $2.010 billion recorded in November 2008. Moreover, total revenue from electronic products during the 12-month period in 2008 also exhibited a decrease of 8.3 percent to 28.501 billion from 31.085 billion.
Articles of Apparel and Clothing Accessories remained the country’s second top earner in December 2008 with a combined share of 6.0 percent and an aggregate receipt of $160.02 million. It was lower by 11.4 percent over last year’s figure of $180.61 million.
Woodcrafts and Furniture followed as the third top earner in December 2008 with total revenue of $81.27 million or a share of 3.0 percent to the total export receipts. It gained by 7.4 percent from $75.67 million in December 2007.
Ranked fourth in December 2008 and contributing 2.9 percent to the total export receipts was Coconut Oil (including crude and refined) with sales amounting to $76.40 million or an annual decrease of 28.9 percent from $107.43 million in December 2007.
Cathodes and Sections of Cathodes, of Refined Copper, with 2.0 percent share to the total export receipts, ranked fifth with revenue amounting to $53.12 million. It fell by 70.9 percent from $182.28 million recorded in December 2007.
Rounding up the list of the top ten exports for the month of December 2008 were Other Products Manufactured from Materials Imported on Consignment Basis with receipts of $47.48 million which rose by 3.3 percent; Ignition Wiring Set and Other Wiring Sets Used in Vehicles, Aircrafts and Ships (consisted only of electrical wiring harness for motor vehicles) valued at $46.22 million, declined by 45.6 percent; Metal Components (excluding brakes and servo - brakes) with receipts of $39.05 million down by 4.5 percent; Bananas (fresh) with proceeds billed at $36.08 million, increased by 9.4 percent; and Pineapple and Pineapple Products with export revenue of $28.86 million accelerated by 29.1 percent from December 2007 level .
Total receipts from the top ten exports reached $1.904 billion, or 71.2 percent of the total exports.
Fig. 1 Philippine Top Five Exports: December 2008 and 2007
(F.O.B. Value in Million US Dollars)
EXPORTS OF MANUFACTURED GOODS STANDS AT $2.218 BILLION
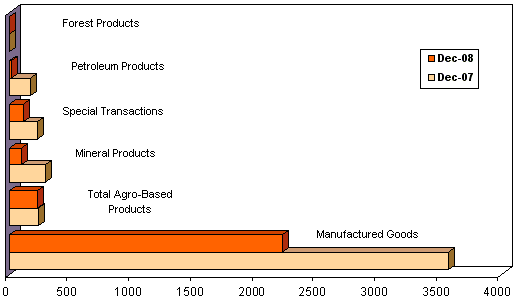
Accounting for 83.0 percent of the total receipts, exports of Manufactured Goods in December 2008 amounted to $2.218 billion. It declined by 37.7 percent from $3.561 billion in the same period last year. The same was true with the previous month’s level, where a decrease of 27.3 percent was noted from $3.052 million.
Income from All Agro-Based Products in December 2008 amounting to $225.87 million or 8.5 percent share of the total exports revenue, decreased by 2.9 percent from $232.61 million in December 2007.
Earnings from Mineral Products in December 2008 which reached $98.96 million or 3.7 percent share of the total exports revenue, fell by 65.8 percent from $289.48 million in December 2007.
Receipts from Petroleum Products in December 2008 totaled to $14.62 million or 0.6 percent share of the total exports revenue, decelerated by 91.4 percent from $170.72 million in December 2007. However, exports revenue of Forest Products with 0.1 percent share of the total exports revenue, grew by 61.3 percent to $2.11 million from $1.31 million recorded a year earlier.
Export receipts from Special Transactions with a share of 4.2 percent decreased by 50.5 percent to $112.31 million from $227.01 million in December 2007.
Fig. 2 Philippine Exports by Commodity Group: December 2008 and 2007
(F.O.B. Value in Million US Dollars)
EXPORTS TO UNITED STATES OF AMERICA ACCOUNT FOR 21.5 PERCENT
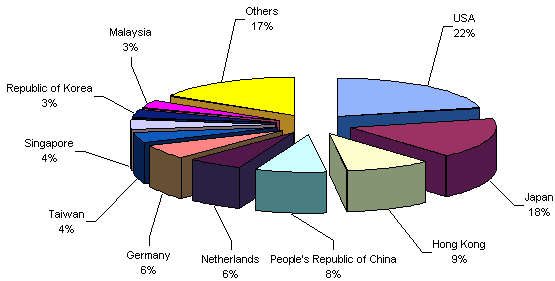
United States of America (USA) remained the top market of the country for December 2008 with export receipts of $574.43 million, accounting for 21.5 percent of the country’s aggregate income for the month, down by 20.8 percent from $725.44 million recorded a year earlier.
Japan followed as the second top market of the country for December 2008 with export earnings of $457.69 million or 17.1 percent share of the total exports, lower by 28.5 percent from $639.76 million in December 2007.
Hong Kong emerged as the third biggest market for December 2008 with shipments amounting to $249.13 million or 9.3 percent of the total exports, a decrease of 49.0 percent from a year ago level of $488.27 million.
People’s Republic of China ranked fourth in December 2008 with $216.76 million or 8.1 percent of the total exports, a decline of 57.9 percent from $515.40 million in December 2007.
Other top ten markets for December 2008 were Netherlands, $166.62 million; Germany, $162.94 million; Singapore, $117.20 million; Republic of Korea, $111.29 million; Thailand, $92.65 million; and Taiwan, $82.24 million.
Total export receipts from RP’s top ten markets for the month of December 2008 amounted to $2.231 billion or 83.5 percent of the total.
Fig. 3 Philippine Top Exports by Country: December 2008
(F.O.B. Value in Million US Dollars)
Technical Note:
Starting with the January 2007 Press Release, analysis and tables are based on the 2004 Philippine Standard Commodity Classification (PSCC) groupings (as amended in 1999). This is in compliance with NSCB Resolution No. 03, Series of 2005 entitled "Approving and Adopting the 2004 Philippine Standard Commodity Classification" by all concerned government agencies and instrumentalities.
(Sgd.) CARMELITA N. ERICTA |
Source: Foreign Trade Statistics Section
Industry and Trade Statistics Department
National Statistics Office
Manila, Philippines
| Attachment | Size |
|---|---|
|
|
10.63 KB |
|
|
9.14 KB |
|
|
12.66 KB |
|
|
10.55 KB |
|
|
7.11 KB |