
MERCHANDISE EXPORT PERFORMANCE *
December 2010
( Preliminary )
* Includes transactions that passed through Automated Export Documentation System (AEDS).
p - preliminary
r - revised
MERCHANDISE EXPORTS FOR DECEMBER 2010 UP BY 25.3 PERCENT
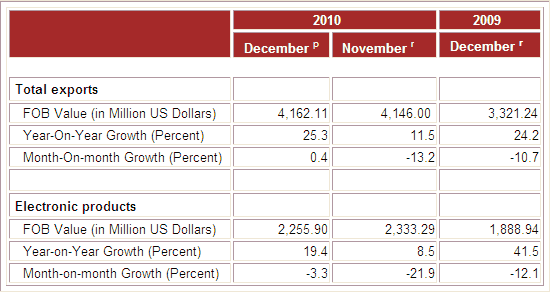
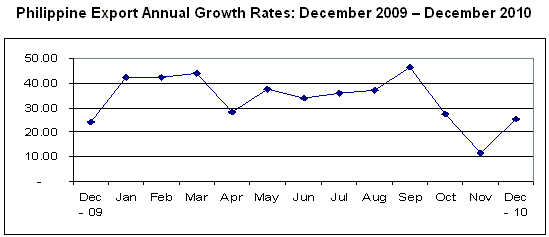
The value of Philippine merchandise exports for December 2010 was estimated at $4.162 billion. It represents a 25.3 percent increase from $3.321 billion recorded in December of 2009. Month - on - month, receipts from merchandise exports went up slightly by 0.4 percent from $4.146 billion posted in November 2010. Aggregate merchandise exports in January to December of 2010, on the other hand, incremented by 33.7 percent to $51.393 billion from $38.436 billion estimated from the same period of 2009.
ELECTRONIC PRODUCTS HIGHER BY 19.4 PERCENT
Accounting for 54.2 percent of the total exports revenue in December 2010, Electronic Products was the country's top export with total receipts of $2.256 billion. It rose by 19.4 percent from $1.889 billion registered in December 2009. Components/Devices (Semiconductors) which comprised 38.8 percent of the total exports, had the biggest share from among the major groups of electronic products with export earnings worth $1.616 billion or an increase of 24.1 percent from $1.302 billion registered in December 2009. On a monthly basis, Electronic Products, however, decreased by 3.3 percent from $2.333 billion posted in November 2010.
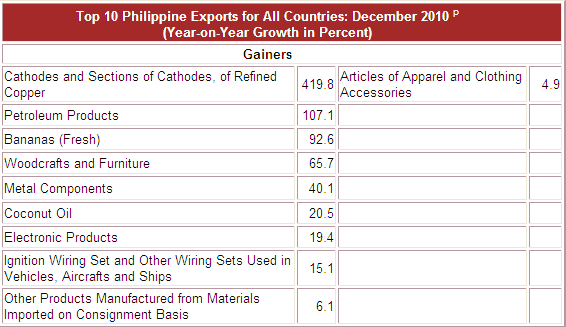
Cathodes & Sections of Cathodes of Refined Copper followed as the second top earner in December 2010 with total export receipts of $139.78 million or a share of 3.4 percent to the total exports revenue. It registered the highest annual growth of 419.8 percent from among the top ten exports from $26.89 million recorded in December 2009.
Articles of Apparel and Clothing Accessories which comprised 3.3 percent share of total exports in December 2010 emerged as the country's third top gainer with revenue valued at $137.91 million, an increase of 4.9 percent from $131.51 million recorded during the same month in 2009.
Ranked fourth in December 2010 and contributing 2.7 percent share to the total export receipts was Woodcrafts and Furniture with revenue amounting to $113.05 million. This figure expanded by 65.7 percent from its year ago level of $68.21 million.
Coconut Oil (including crude and refined) with 2.5 percent share to the total export receipts ranked fifth with value posted at $105.32 million or an equivalent 20.5 percent increment from $87.40 million posted in December 2009.
Rounding up the list of the top ten exports for the month of December 2010 were Ignition Wiring Set and Other Wiring Sets Used in Vehicles, Aircrafts and Ships (consisting only of electrical wiring harness for motor vehicles) with export revenue of $98.59 million grew by 15.1 percent; Petroleum Products (including refined petroleum products, manufactured from crude petroleum oil imported on consignment basis) with export earnings of $72.39 million accelerated by 107.1 percent; Metal Components (excluding brakes and servo - brakes) with export receipts of $66.43 million climbed to 40.1 percent growth rate; Other Products Manufactured from Materials Imported on Consignment Basis with recorded sales amounting to $57.96 million improved by 6.1 percent; and Bananas (Fresh) with proceeds billed at $45.19 million was up by 92.6 percent.
Total receipts from the top ten exports reached $3.093 billion, or 74.3 percent of the total exports.
Fig. 1 Philippine Top Five Exports: December 2010 and 2009
(F.O.B. Value in Million US Dollars)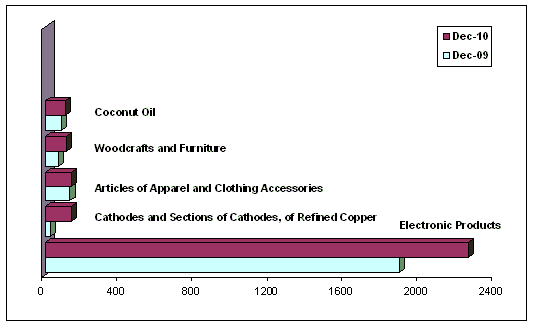
EXPORTS OF MANUFACTURED GOODS STOOD AT $3.402 BILLION
Accounting for 81.7 percent of the total export receipts in December 2010, outward shipments of Manufactured Goods was estimated at $3.402 billion, representing an increase of 20.7 percent from $2.818 billion recorded in the same period a year earlier. Month-on-month, however, it went down by 4.3 percent from $3.553 billion recorded in November 2010.
Income from Total Agro-Based Products comprising 7.1 percent share of the total exports revenue in December 2010 rose by 39.0 percent to $297.18 million from $213.76 million in December 2009. Compared to its previous month level, it increased by 31.9 percent from $225.24 million in November 2010.
Earnings from Mineral Products with a share of 6.3 percent in December 2010 reached $261.62 million. It swelled by 149.3 percent from $104.94 million in December 2009. However, export receipts from Special Transactions reflecting 3.1 percent share was lower by 14.0 percent from $147.71 million posted in December 2009 to $127.04 million in December 2010.
Petroleum Products accounting for 1.7 percent share of the total exports revenue grew by 107.1 percent to $72.39 million from $34.95 million in December 2009. Meanwhile, Forest Products with 0.05 percent share exhibited negative growth of 6.3 percent from $2.06 million in December 2009 to $1.93 million in December 2010.
Fig. 2 Philippine Exports by Commodity Group: December 2010 and 2009
(F.O.B. Value in Million US Dollars)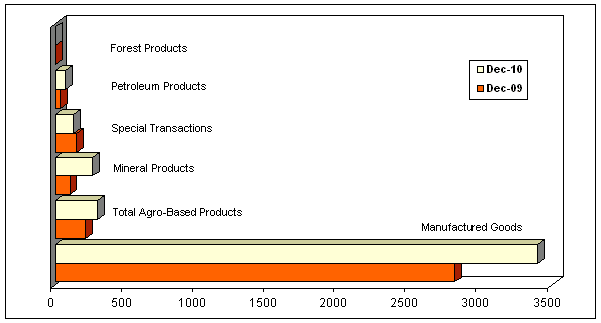
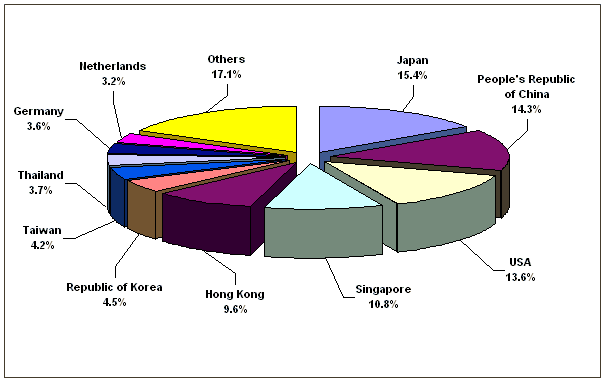
EXPORTS TO JAPAN ACCOUNTED FOR 15.4 PERCENT
Japan including Okinawa comprising 15.4 percent share to total exports for December 2010 emerged as the country's top destination of exports for December 2010 with revenue amounting to $642.73 million. It was higher by 26.4 percent from $508.48 million recorded a year ago.
People's Republic of China with 14.3 percent share to total exports followed as the second top market of the country for December 2010 with export earnings worth $594.81 million. This represents an increase of 151.8 percent from $236.22 million reported a year earlier.
United States of America (USA) including Alaska and Hawaii accounting for 13.6 percent share to total exports came in third with shipments amounting to $563.92 million. Compared to its December 2009 level, the amount diminished by 11.3 percent from $635.58 million.
Singapore ranked fourth in December 2010 with $449.94 million or 10.8 percent share of the total exports, expanded by 58.9 percent from it's year ago value of $283.19 million.
Fifth in rank and representing 9.6 percent share to total exports was Hong Kong with export earnings worth $399.74 million or an increase of 83.7 percent from $217.63 million posted in December 2009.
Other top ten markets for December 2010 were Republic of Korea, $185.57 million; Taiwan, $176.56 million; Thailand, $153.61 million; Germany, $150.53 million; and Netherlands, $132.20 million.
Total export receipts from the country's top ten markets for the month of December 2010 amounted to $3.450 billion or 82.9 percent of the total.
Fig. 3 Philippine Top Exports by Country: December 2010
(F.O.B. Value in Million US Dollars)
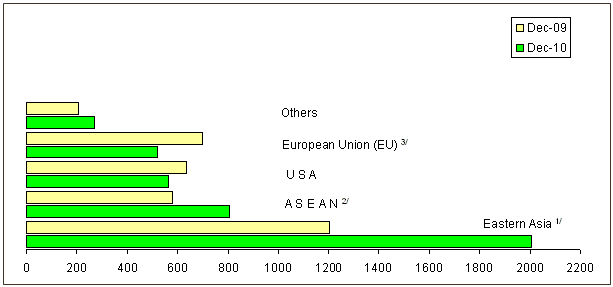
EXPORTS TO EASTERN ASIA STOOD AT $2.006 BILLION
The Philippines' merchandise exports to Eastern Asia in December 2010 amounted to $2.006 billion (48.2 %), an increase of 66.7 percent from it's December 2009 figure of $1.204 billion.
Exports to ASEAN member-countries accounting for 19.3 percent share to total merchandise exports reached $804.51 million, a 39.2 percent positive growth from $577.92 million recorded in December 2009.
On the other hand, merchandise exports to European Union (EU) which accounts for 12.5 percent of total merchandise exports in December 2010 were valued at $519.93 million. The value declined by 25.6 percent from $699.19 million posted in December 2009.
Fig. 4 Philippine Exports by Selected Economic Bloc: December 2010 & 2009
(F.O.B. Value in Million US Dollars)
Notes:
1/ - includes China, Hong Kong, Japan, Macau, Mongolia, N, Korea, S. Korea, Taiwan
2/ - includes Brunei Darussalam, Cambodia, Indonesia, Laos, Malaysia, Myanmar, Singapore, Thailand, Vietnam
3/ - includes Austria, Belgium, Bulgaria, Cyprus, Czech Republic, Denmark, Estonia, Finland, France, Germany, Greece, Hungary, Ireland, Italy, Latvia, Lithuania, Malta, Netherlands, Poland, Portugal, Romania, Slovakia, Slovenia, Spain, Sweden, Latvia, and UK Great Britain & N. Ireland
Technical Note:
Starting with the January 2007 Press Release, analysis and tables are based on the 2004 Philippine Standard Commodity Classification (PSCC) groupings (as amended in 1999). This is in compliance with NSCB Resolution No. 03, Series of 2005 entitled "Approving and Adopting the 2004 Philippine Standard Commodity Classification" by all concerned government agencies and instrumentalities.
(Sgd.) CARMELITA N. ERICTA
Administrator
Source: Foreign Trade Statistics Section
Industry and Trade Statistics Department
National Statistics Office
Manila, Philippines