
MERCHANDISE EXPORT PERFORMANCE*
December 2012
(Preliminary)

* Include transactions that passed through Automated Export Documentation System (AEDS) and Electronic to Mobile (E2M).
p - preliminary
r - revised
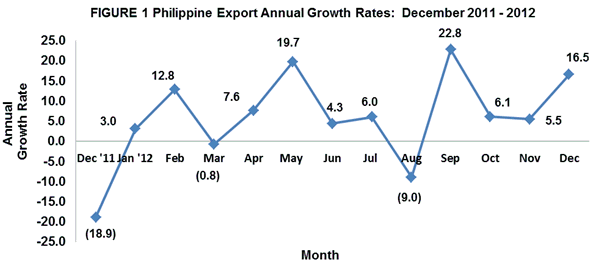
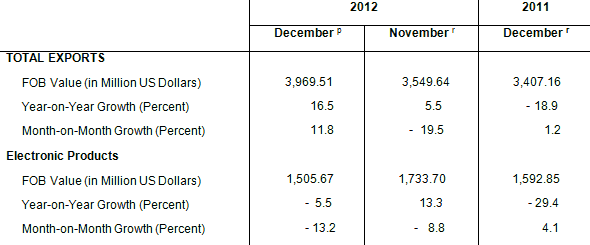
DECEMBER MERCHANDISE EXPORTS GROW BY 16.5 PERCENT
Merchandise exports grew by 16.5 percent in December 2012 to $3.970 billion from $3.407 billion in December 2011. The sustained increment was supported by the positive year-on-year change in bananas (fresh), petroleum products, metal components, tuna and woodcrafts and furniture. Similarly, on a monthly basis, it expanded by 11.8 percent from $3.550 billion posted in November 2012. Likewise, cumulative merchandise exports for January to December 2012 recorded a positive growth of 7.6 percent to $51.994 billion from $48.305 billion posted during the same period of 2011. Meanwhile, record showed that volume of outward shipments had a positive year-on-year performance of 94.8 percent and 29.7 percent compared to last month’s outward shipments.
ELECTRONIC PRODUCTS LOWER BY 5.5 PERCENT
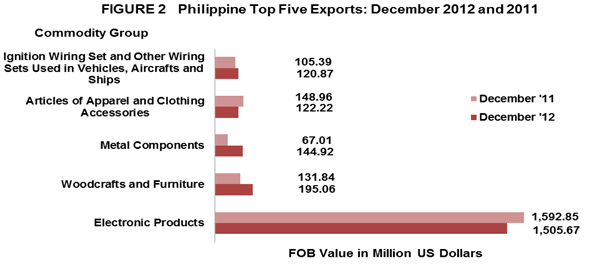
Electronic Products with 37.9 percent contribution to total export revenue fell by 5.5 percent from $1.593 billion to $1.506 billion in December 2012. Similarly, value of outward shipments went down by 13.2 percent compared to same month last year. Components/Devices (Semiconductors) comprising 30.7 percent of the total exports, had the biggest share among the major groups of electronic products with export earnings worth $1.220 billion registering an increase of 3.5 percent from $1.179 billion in December 2011. However on a monthly basis, electronic products as well as semiconductors decelerated by 13.2 percent and 13.0 percent, respectively. Similarly, volume of outward shipments of electronic products and semiconductors also declined by 14.3 percent and 13.6 percent, respectively compared to same period a year ago.
Woodcrafts and Furniture with 4.9 percent share to the total value of exports for December 2012 was recorded as the country’s second top export with revenue valued at $195.06 million. This figure exhibited a growth of 48.0 percent compared with its year ago level of $131.84 million. Likewise, volume of this product grew by 30.4 percent compared to the same period last year.
Metal Components (excluding brakes & servo-brakes) followed as the third top export earner in December 2012 with total receipts of $144.92 million or a share of 3.7 percent to total exports revenue. It expanded by 116.3 percent compared with its year ago level of $67.01 million. Outward shipments of this product also showed an expansion of 5.4 percent compared to its year ago recorded shipment.
Ranked fourth in December 2012 and contributing 3.1 percent share to the total export receipts were Articles of Apparel and Clothing Accessories with earnings amounting to $122.22 million. It went down by 18.0 percent from $148.96 million registered in December 2011. Furthermore, volume of shipments of this commodity showed a 13.7 percent decrease compared to last year same month period.
Ignition Wiring Set and Other Wiring Sets Used in Vehicles, Aircrafts and Ships consisting only of electrical wiring harness for motor vehicles with 3.0 percent share to the total export receipts ranked fifth with value posted at $120.87 million. It increased by 14.7 percent from $105.39 million recorded in December 2011. Similarly, volume of outward shipments increased by 24.7 percent compared to it’s a year ago volume of shipments.
Rounding up the list of the top ten exports for the month of December 2012 were Petroleum Products with export revenue of $95.10 million increasing by 137.0 percent; Coconut Oil including crude and refined with export receipts of $93.20 million, losing by 6.0 percent; Bananas (fresh) accelerating by 155.5 percent from $30.08 million to $76.85 million registering the highest annual increase among the top ten exports; Gold (extracted from copper ores and concentrates) with recorded sales of $53.59 million rising by 2.5 percent; and Tuna (includes fresh, frozen, prepared or preserved in airtight containers) with proceeds billed at $46.21 million leading by 51.9 percent compared to same month last year.
Total receipts from the top ten exports reached $2.454 billion, or 61.8 percent of the total exports.
EXPORTS OF MANU
Exports of Manufactured Goods, accounting for 81.4 percent of the total export receipts, rose by 17.8 percent in December 2012 to $3.231 billion from $2.742 billion in December 2011. Similarly, receipts went up by 2.9 percent compared to recorded value of $3.139 billion in November 2012. On the other hand, outward shipments in terms of gross kilos showed a positive year-on-year change of 151.3 percent compared to shipment in December 2011 and 80.4 percent increase in volume of shipment compared to last month.
Income from Total Agro-Based Products, comprising 9.6 percent share of the total exports revenue in December 2012, went up by 19.1 percent to $379.76 million from $318.75 million. Similarly, it expanded by 130.5 percent from $164.74 million in November 2012. Likewise, volume of shipments grew by 34.3 percent and 45.8 percent, respectively compared to same month a year ago and previous month in 2012. The growth was mainly due to the increase in both the value and volume of coconut products, fruits and vegetables.
Earnings from Mineral Products with a share of 4.8 percent reached $190.03 million. It fell by 2.9 percent from $195.76 million in December 2011. On the other hand, export receipts from Petroleum Products, with a 2.4 percent share to total export earnings, registered at $95.10 million. This product soared by 137.0 percent in terms of value and 156.7 percent in terms of volume compared to same month a year ago.
Commodities under Special Transactions consisting of gifts, donations, machinery and equipment returned to the country, replacement of returned goods and the likes, reflecting 1.7 percent share to total exports, was lower by 35.9 percent from $105.66 million in December 2011 to $67.77 million in December 2012. Similarly, volume of shipments of these products categorized under special transactions, showed a decrease of 64.4 percent compared to December 2011 recorded volume of outward shipments. Forest Products accounting for 0.1 percent share of the total exports revenue increased by 29.9 percent to $5.84 million from $4.49 million in December 2011. Moreover, volume of shipments of this product strengthened by 37.4 percent compared to same period last year.

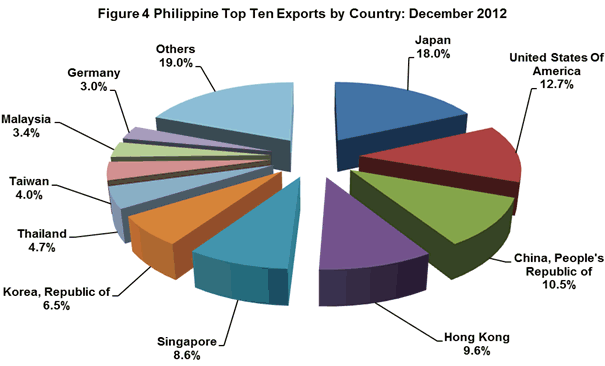
EXPORTS TO JAPAN ACCOUNT FOR 18.0 PERCENT
Japan including Okinawa, getting 18.0 percent share of the total exports for December 2012, emerged as the country’s top destination of exports with revenue amounting to $715.29 million. It was higher by 12.7 percent compared with $634.87 million recorded a year ago. The export items to Japan consist mainly of wood manufactures and components/devices (semiconductors).
United States of America (USA) including Alaska and Hawaii with 12.7 percent share to total exports followed as the second top market of the country for December 2012 with export earnings worth $502.31 million. This represented a decrease of 5.9 percent from $533.92 million reported a year earlier. Electronic products particularly components/devices (semiconductors) and garments are the goods mostly exported to USA.
People’s Republic of China, accounting for 10.5 percent share to total exports, came in third with shipments amounting to $417.18 million. Compared to the same month a year ago, however, its value contracted by 10.8 percent from $467.86 million. Products exported to China comprised mostly of electronics and other mineral products.
Hong Kong, with 9.6 percent share of the total exports, ranked fourth in December 2012 with $380.62 million. This value was higher by 51.3 percent from last year’s level of $251.49 million.
Fifth in rank and representing 8.6 percent share to total exports was Singapore with export earnings worth $340.17 million which recorded a growth of 43.2 percent from $237.49 million posted in December 2011.
Other top ten markets for December 2012 were Republic of Korea, $259.58 million; Thailand, $187.51 million; Taiwan, $158.46 million; Malaysia including Sabah and Sarawak, $135.02 million; and Germany, $118.92 million.
Total export receipts from the country’s top ten markets for the month of December 2012 amounted to $3.215 billion or about 81.0 percent of the total.
EXPORTS TO EAST
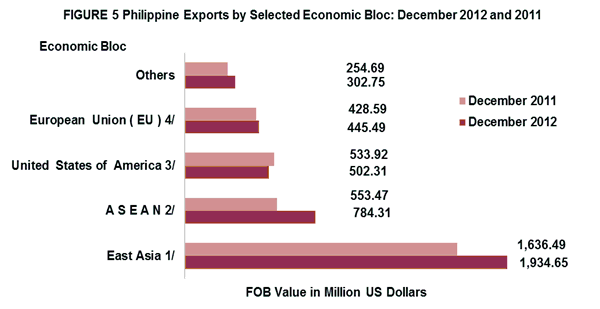
The merchandise exports of the Philippines to East Asia (China, Hong Kong, Japan, Macau, Mongolia, North Korea, South Korea and Taiwan) in December 2012 accounted for 48.7 percent share of total exports, amounting to $1.935 billion or an increase of 18.2 percent from its December 2011 figure of $1.636 billion.
Exports to ASEAN member-countries, accounting for 19.8 percent share to total merchandise exports in December 2012 reached $784.31 million and grew by 41.7 percent from $553.47 million recorded in December 2011.
Merchandise exports to European Union (EU), sharing 11.2 percent to total merchandise exports in December 2012, was valued at $445.49 million. It was higher by 3.9 percent from $428.59 million posted in December 2011.
Notes:
1/ - includes China, Hong Kong, Japan, Macau, Mongolia, N, Korea, S. Korea, Taiwan
2/ - includes Brunei Darussalam, Cambodia, Indonesia, Laos, Malaysia, Myanmar, Singapore, Thailand, Vietnam
3/ - includes Alaska and Hawaii
4/ - includes Austria, Belgium, Bulgaria, Cyprus, Czech Republic, Denmark, Estonia, Finland, France, Germany, Greece,
Hungary, Ireland, Italy, Latvia, Lithuania, Luxembourg, Malta, Netherlands, Poland, Portugal, Romania, Slovakia,
Slovenia, Spain, Sweden and UK Great Britain
Technical Note:
Starting with the February 2007 Press Release, analysis and tables are based on the 2004 Philippine Standard Commodity Classification (PSCC) groupings. This is in compliance with NSCB Resolution No. 03, Series of 2005 entitled “Approving and Adopting the 2004 Philippine Standard Commodity Classification” by all concerned government agencies and instrumentalities.
CARMELITA N. ERICTA
Administrator
Source: Foreign Trade Statistics Section
Industry and Trade Statistics Department
National Statistics Office
Manila, Philippines