
MERCHANDISE EXPORT PERFORMANCE*
July 2012
(Preliminary)

* Includes transactions that passed through Automated Export Documentation System (AEDS) and Electronic to Mobile (E2M).
p - preliminary
r - revised
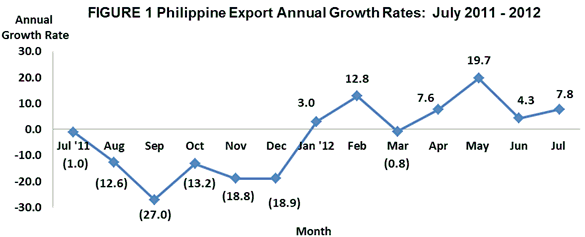
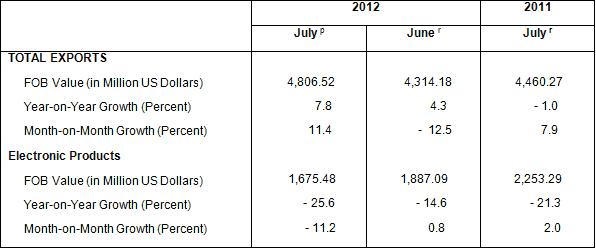
MERCHANDISE EXPORTS FOR JULY 2012 UP BY 7.8 PERCENT
Export earnings in July 2012 went up by 7.8 percent to $4.807 billion from $4.460 billion recorded in July 2011. The increase can be attributed to the higher annual growth in seven out of the ten top Philippine exports in July 2012 including activated carbon, metal components, bananas, ignition wiring set and other wiring sets used in vehicles, aircrafts and ships, pineapple and pineapple products, tuna and woodcrafts and furniture. Similarly, on a monthly basis, it grew by 11.4 percent from $4.314 billion posted in June 2012. Cumulative merchandise exports for the first seven months of 2012 also showed a positive growth of 7.7 percent to $31.564 billion from $29.306 billion posted during the same period of 2011.
ELECTRONIC PRODUCTS DECREASE BY 25.6 PERCENT
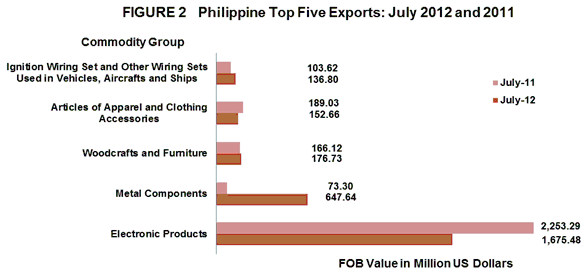
Electronic Products emerged as the country’s top export with total receipts of $1.675 billion. It accounted for 34.9 percent of the total exports revenue in July 2012. However, it went down by 25.6 percent from $2.253 billion registered in July 2011. This was due to the decrease of 12.1 percent in Components/Devices (Semiconductors), which comprises 28.0 percent of the total exports and the biggest share among the major groups of electronic products, to $1.344 billion from $1.529 billion registered in July 2011. On a monthly basis, growth of electronic products showed a decline since April 2012. It decreased by 11.2 percent from $1.887 billion posted value in June 2012. However, volume of outward shipment of electronic products particularly the semiconductors grew by 17.3 percent compared to same period a year ago.
Metal Components, with 13.5 percent share in the total value of exports for July 2012, was recorded as the country’s second top export with revenue valued at $647.64 million. This figure exhibited a growth of 783.6 percent compared to its year ago level of $73.30 million. However, in terms of volume, this product fell by 0.7 percent from same period last year.
Woodcrafts and Furniture followed as the third top export earner in July 2012 with total receipts of $176.73 million or a share of 3.7 percent to total exports revenue. It expanded by 6.4 percent compared to same month a year ago level of $166.12 million.
Ranked fourth in July 2012 and contributing 3.2 percent share to the total export receipts were Articles of Apparel and Clothing Accessories with earnings amounting to $152.66 million. It declined by 19.2 percent from $189.03 million registered in July 2011. Furthermore, volume of shipments of this commodity showed a 30.0 percent drop compared to last year same month period.
Ignition Wiring Set and Other Wiring Sets Used in Vehicles, Aircrafts and Ships consisting only of electrical wiring harness for motor vehicles, with 2.8 percent share to the total export receipts, ranked fifth with value posted at $136.80 million. It increased by 32.0 percent from $103.62 million recorded in July 2011. In terms of the outward shipments in volume, it expanded by 35.7 percent compared to its a year ago volume of shipment.
Rounding up the list of the top ten exports for the month of July 2012 were Coconut Oil including crude and refined with export revenue of $105.02 million decreasing by 29.9 percent; Bananas (Fresh) with export receipts of $68.50 million, growing by 57.0 percent; Pineapple and Pineapple Products with export earnings of $46.95 million increasing by 17.5 percent; Activated Carbon with recorded sales of $39.56 million registered the highest growth of 973.6 percent among the top ten exports and with outward volume of shipments growing by 131.0 percent; and Tuna which includes fresh, frozen, prepared or preserved in airtight containers with proceeds billed at $27.68 million rising by 7.2 percent.
Total receipts from the top ten exports reached $3.077 billion, or 64.0 percent of the total exports.
EXPORTS OF MANU
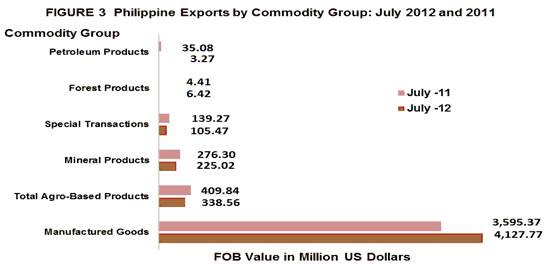
Accounting for 85.9 percent of the total export receipts in July 2012, value of outward shipments of Manufactured Goods was estimated at $4.128 billion, representing an increase of 14.8 percent from $3.595 billion recorded in July 2011. Similarly, it went up by 16.1 percent compared to recorded value of $3.556 billion in June 2012. The annual increment was due to the positive annual growth in exports of other electronic products, footwear, wood manufactures, chemicals, non-metallic mineral manufactures, machinery and transport equipment, processed food and beverage, iron and steel, baby carr., toys , games and sporting goods and other miscellaneous manufactured articles. Similarly, it went up by 16.1 percent compared to recorded value of $3.556 billion in June 2012.
Income from Total Agro-Based Products comprising 7.0 percent share of the total exports revenue in July 2012 went down by 17.4 percent from $409.84 million to $338.56 million. The decline was due to low performances in total exports for coconut oil, desiccated coconut and sugar and sugar products. However, compared to its previous month level, it rose by 13.0 percent from $299.70 million in June 2012.
Earnings from Mineral Products with a share of 4.7 percent reached $225.02 million. It went down by 18.6 percent from $276.30 million in July 2011. Similarly, export receipts from Special Transactions which consist of commodities like gifts, donations, machinery and equipment returned to the country, replacement of returned goods and the likes reflecting 2.2 percent share was lower by 24.3 percent from $139.27 million to $105.47 million in July 2012.
Forest Products accounting for 0.1 percent share of the total exports revenue increased by 45.7 percent to $6.42 million from $4.41 million. Moreover, Petroleum Products with almost 0.1 percent share was down by 90.7 percent from $35.08 million in July 2011 to $3.27 million in July 2012.
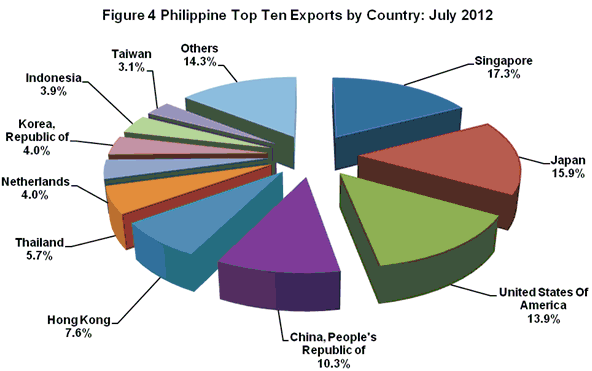
EXPORTS TO SINGAPORE ACCOUNT FOR 17.3 PERCENT
Singapore getting 17.3 percent share of the total exports for July 2012 emerged as the country’s top destination of exports with revenue amounting to $832.45 million. It was higher by 137.1 percent from $351.13 million recorded a year ago. The export items to Singapore consist mainly of machinery and transport equipment and components/devices (semiconductors).
Japan including Okinawa with 15.9 percent share to total exports followed as the second top market of the country for July 2012 with export earnings worth $764.13 million. This represented a decrease of 27.5 percent from $1.055 billion reported a year earlier.
United States of America (USA) including Alaska and Hawaii accounting for 13.9 percent share to total exports came in third with shipments amounting to $667.64 million. Compared to same month a year ago, this value grew by 2.5 percent from $651.59 million.
People’s Republic of China ranked fourth in July 2012 with $495.21 million or 10.3 percent share of the total exports. The amount dropped by 13.7 percent from last year’s amount of $573.56 million.
Fifth in rank and representing 7.6 percent share to total exports was Hong Kong with export earnings worth $365.95 million or an increase of 25.8 percent from $290.89 million posted in July 2011.
Other top ten markets for July 2012 were Thailand, $273.17 million; Netherlands, $192.60 million; Republic of Korea, $191.48 million; Indonesia, $188.31 million; and Taiwan, $149.44 million.
Total export receipts from the country’s top ten markets for the month of July 2012 amounted to $4.120 billion or 85.7 percent of the total.
EXPORTS TO EAST
The merchandise exports of the Philippines to East Asia (China, Hong Kong, Japan, Macau, Mongolia, North Korea, South Korea and Taiwan)in July 2012 accounted 41.0 percent share to total exports, amounting to $1.970 billion or a decrease of 11.0 percent from its July 2011 figure of $2.213 billion.
Exports to ASEAN member-countries, accounting for 29.1 percent share to total merchandise exports in July 2012, reached $1.400 billion and grew by 96.3 percent from $713.21 million recorded in July 2011.
Merchandise exports to European Union (EU) sharing 10.3 percent to total merchandise exports in July 2012 was valued at $493.98 million. It contracted by 17.3 percent from $597.14 million posted in July 2011.

Notes:
1/ - includes China, Hong Kong, Japan, Macau, Mongolia, N, Korea, S. Korea, Taiwan
2/ - includes Brunei Darussalam, Cambodia, Indonesia, Laos, Malaysia, Myanmar, Singapore, Thailand, Vietnam
3/ - includes Alaska and Hawaii
4/ - includes Austria, Belgium, Bulgaria, Cyprus, Czech Republic, Denmark, Estonia, Finland, France, Germany, Greece, Hungary, Ireland, Italy, Latvia, Lithuania, Malta, Netherlands, Poland, Portugal, Romania, Slovakia, Slovenia, Spain, Sweden, Latvia, and UK Great Britain & N. Ireland
Technical Note:
Starting with the January 2007 Press Release, analysis and tables are based on the 2004 Philippine Standard Commodity Classification (PSCC) groupings. This is in compliance with NSCB Resolution No. 03, Series of 2005 entitled “Approving and Adopting the 2004 Philippine Standard Commodity Classification” by all concerned government agencies and instrumentalities.
| (Sgd.) CARMELITA N. ERICTA Administrator |