
MERCHANDISE EXPORTS PERFORMANCE
JULY 2015
(Preliminary)
|
|
July
|
||
|---|---|---|---|
|
|
2015 p |
2014 r |
|
|
TOTAL EXPORTS FOB Value in Million US Dollars Year-on-Year Growth (Percent) Electronic Products FOB Value in Million US Dollars Year-on-Year Growth (Percent) |
5,326.93 -1.8
2,818.17 34.6 |
5,425.48 11.7
2,093.20 2.8 |
|
|
Top 10 Philippine Exports to All Countries: July 2015 p
(Year-on-Year Growth in Percent)
|
|||
|---|---|---|---|
Gainers |
Losers |
||
|
Electronic Products
|
34.6 |
Other Mineral Products
|
-66.6 |
|
Woodcrafts and Furniture
|
5.9 |
Machinery and Transport Equipment
|
-55.2 |
|
|
Articles of Apparel and Clothing Accessories
|
-37.3 | |
|
|
Metal Components
|
-29.1 | |
|
|
Chemicals
|
-26.0 | |
|
Coconut Oil
|
-14.7 | ||
|
Ignition Wiring Set and Other Wiring Sets Used in Vehicles, Aircrafts and Ships
|
-7.4 | ||
|
Other Manufactures
|
-4.6 | ||
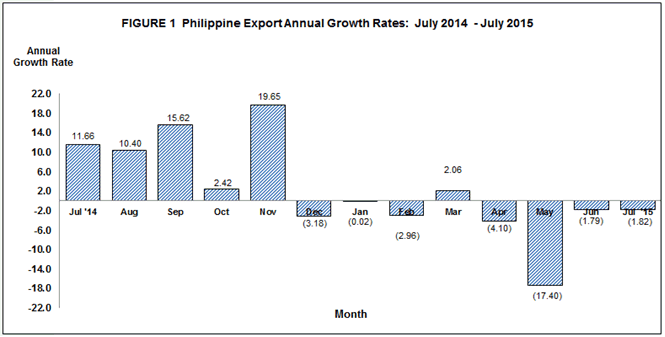
EXPORTS IN JULY 2015 DECLINED BY 1.8 PERCENT
The country’s export revenues totaled $5.327 billion in July 2015, a 1.8 percent decline from $5.425 billion recorded value in July of 2014. The negative growth was mainly brought about by the decrease of eight major commodities out of the top ten commodities for the month. These include other mineral products; machinery & transport equipment; articles of apparel and clothing accessories; metal components; chemicals; coconut oil; ignition wiring set and other wiring sets used in vehicles, aircrafts and ships; and other manufactures (Table 1).
Cumulative merchandise exports for the seven-month period in 2015 registered a 4.1 percent decrease, that is from $35.659 billion in 2014 to $34.214 billion in same period of 2015 (Table 1a).
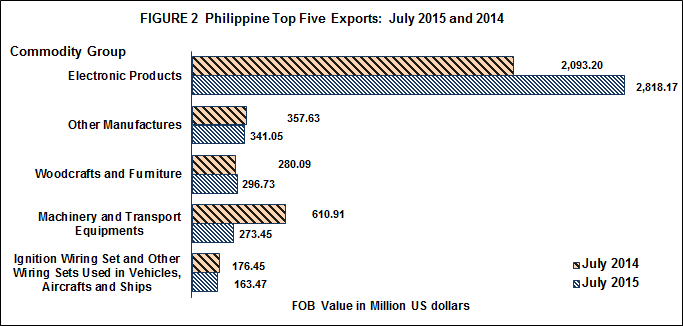
ELECTRONIC PRODUCTS INCREASED BY 34.6 PERCENT
Electronic Products remained as the country’s top export with total receipts of $2.818 billion, accounting for 52.9 percent of the total exports revenue in July 2015. It increased by 34.6 percent from $2.093 billion registered in July 2014. Components/Devices (Semiconductors), had the biggest share of 42.2 percent among electronic products and grew by 55.0 percent to $2.247 billion in July 2015 from $1.450 billion in July 2014.
Other Manufactures, with 6.4 percent share to the total export receipts, ranked second with value posted at $341.05 million. This recorded a decrease of 4.6 percent from July 2014 value of $357.63 million.
Woodcrafts and Furniture ranked third, with sales amounting to $296.73 million in July 2015, contributing 5.6 percent share to the total export receipts. This registered a 5.9 percent positive growth from the previous year level of $280.09 million.
Machinery and Transport Equipment was the fourth top export earner in July 2015 with export revenue of $273.45 million, declined by 55.2 percent from $610.91 million in July 2014.
Ignition Wiring Set and Other Wiring Sets Used in Vehicles, Aircrafts and Ships was recorded as the country’s fifth top export with revenue valued at $163.47 million or 3.1 percent share to total exports. It contracted by 7.4 percent from $176.45 million in same period of 2014.
Rounding up the list of the top ten exports for the month of July 2015 were: Chemicals with export earnings of $155.93 million, went down by 26.0 percent; Other Mineral Products with export receipts of $119.28 million, dropped by 66.6 percent; Articles of Apparel and Clothing Accessories with proceeds billed at $117.11 million, declined by 37.3 percent; Metal Components with export receipts of $98.00 million, decline by 29.1 percent; and Coconut oil with total receipts of $92.37 million, decreased by 14.7 percent.
Total receipts from the top ten exports reached $4.476 billion, or 84.0 percent of the total exports.
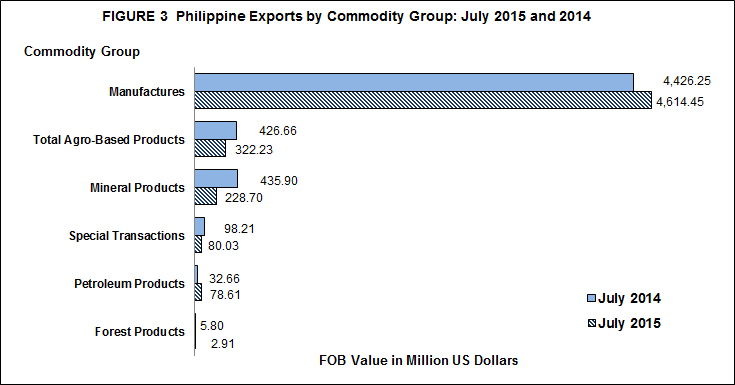
EXPORTS OF MANUFACTURED GOODS ROSE BY 4.3 PERCENT
Outbound shipments of Manufactured Goods were valued at $4.614 billion, accounting for 86.6 percent of the total export receipts in July 2015. It rose by 4.3 percent from $4.426 billion recorded in July 2014 (Table 2).
Receipts from Total Agro-Based Products, with a share of 6.0 percent in July 2015, amounted to $322.23 million. It dropped by 24.5 percent from $426.66 million in July 2014.
Mineral Products which registered a 4.3 percent share, decreased by 47.5 percent from $435.90 million in July 2014 to $228.70 million in July 2015.
Merchandise exports from Special Transactions comprised 1.5 percent share of the total exports revenue in July 2015. This registered a contraction of 18.5 percent from $98.22 million of previous level to $80.03 million in July 2015.
Petroleum Products with 1.5 percent share, remarkably increased by 140.7 percent to $78.61 million in July 2015 from $32.66 million in same month of 2014.
Moreover, sales from Forest Products which accounted for 0.1 percent share of the total exports, decelerated by 49.8 percent from $5.80 million in July 2014 to $2.91 million reported value in same period of 2015.
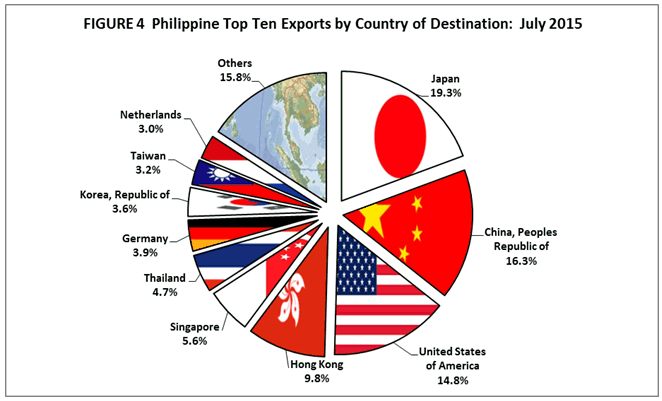
JAPAN ACCOUNTED FOR 19.3 PERCENT TO TOTAL EXPORTS
Japan including Okinawa remained as the country’s top destination of exports with revenue amounting to $1.031 billion, comprising 19.3 percent share to total exports for July 2015. It decreased by 14.6 percent from $1.207 billion recorded value in same month a year ago.
People’s Republic of China with 16.3 percent share to total exports, ranked second with shipments valued at $867.94 million in July 2015. It went up by 24.1 percent from $699.36 million in same month a year ago.
United States of America (USA) including Alaska and Hawaii ranked third, accounting 14.8 percent to total exports, with export receipts valued at $787.94 million in July 2015. This recorded a slight increase of 0.4 percent from $784.41 million in same month last year.
Hong Kong ranked fourth in July 2015 with $520.46 million or 9.8 percent share of the total exports. It fell by 23.6 percent from $681.43 million year ago level.
Singapore placed fifth, representing a 5.6 percent share to total exports, with export earnings worth $300.85 million. It decelerated by 14.5 percent from $351.94 million posted in July 2014.
Other top ten market destinations for July 2015 were: Thailand, $252.12 million; Germany, $207.59 million; Republic of Korea, $192.07 million; Taiwan, $167.92 million; and Netherlands, $157.91 million.
Total export receipts from the country’s top ten market destinations for the month of July 2015 was valued at $4.486 billion or 84.2 percent of the total (Table 3).
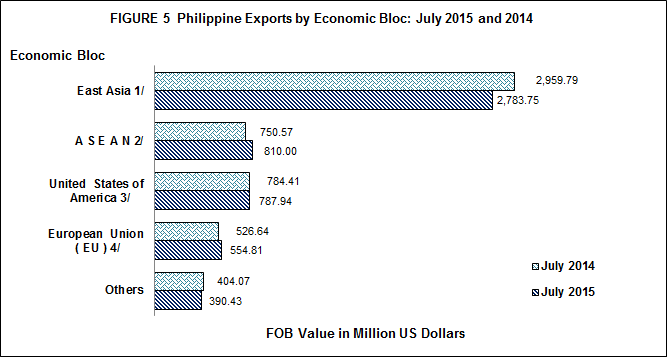
MORE THAN 50.0 PERCENT OF EXPORTS WERE FOR COUNTRIES IN EAST ASIA
The bulk of the country’s merchandise exports in July 2015 were from countries in East Asia which accounted for 52.3 percent share to total exports and valued at $2.784 billion. It decreased by 5.9 percent from $2.960 billion of July 2014 figure.
Products exported to ASEAN member countries comprised 15.2 percent of the total exports in July 2015 and was valued at $810.00 million. This registered an increase of 7.9 percent from $750.57 million posted in same month a year ago.
Exports to European Union member countries, with 10.4 percent share to total merchandise exports amounted to $554.81 million. It increased by 5.3 percent from $526.64 million recorded in July 2014 (Table 3a).
Technical Notes:
1.) Starting with the June 2007 Press Release, analysis and tables are based on the 2004 Philippine Standard Commodity Classification (PSCC) groupings. This is in compliance with the former NSCB Resolution No. 03, Series of 2005 entitled “Approving and Adopting the 2004 Philippine Standard Commodity Classification” by all concerned government agencies and instrumentalities.
2.) Starting 2014 export revised FOB value, all transactions that pass through all Value Added Service Providers (VASPs) of Bureau of Customs (BOC) and Philippine Economic and Zone Authority (PEZA) were included. Physical export declaration and electronic data files were the basis of export statistics.
(Sgd.) LISA GRACE S. BERSALES, Ph. D.
National Statistician