
|
||||||||||||||||||||||||||||||||||||||||||||||||
|
|
|||
|
Top 10 Philippine Exports for All Countries: June 2005 |
|||
|
Gainers |
Losers |
||
|
Other Products Manufactured from |
105.1 |
Articles of Apparel and Clothing Accessories |
(6.1) |
|
Petroleum Products |
87.2 |
Electronic Products |
(4.7) |
|
Metal Components |
44.8 |
||
|
Cathodes and Sections of |
39.0 |
||
|
Coconut Oil |
20.8 |
||
|
Ignition Wiring Set and Other Wiring Sets used in Vehicles, Aircrafts and Ships |
12.4 |
||
|
Woodcrafts and Furniture |
9.0 |
||
|
Bananas (Fresh) |
1.7 |
||
* Does not include transactions that passes through AEDS at Subic.
Merchandise exports inch up by 1.0 percent
Export earnings for June 2005 slightly increased by 1.0 percent to $3.352 billion from $3.318 billion during the same period a year ago.
Receipts from merchandise exports during the period January to June 2005 gained by 3.3 percent to $19.397 billion from $18.784 billion during the same period of the previous year.
Electronic products decrease by 4.7 percent
Electronic products, accounting for 64.8 percent of the aggregate export revenue in June, declined by 4.7 percent to $2.173 billion from $2.279 billion a year earlier. Decreases were observed in five electronic groups with communication/radar contributing the highest negative growth of 58.3 percent share.
Among the major groups of electronic products, components/devices (Semiconductors) got the biggest share with 48.0 percent to total exports. Semiconductors posted a positive rate at 2.4 percent to $1.608 billion from $1.570 billion during the same month in 2004 due to the higher demand in integrated circuits (IC) and diodes.
Articles of apparel and clothing accessories remained as the country’s second top earner with a combined share of 5.6 percent and an aggregate receipt of $187.79 million or 6.1 percent lower than $199.94 million a year earlier.
Other products manufactured from materials imported on consignment basis, ranked third with sales amounting to $67.94 million or a year-on-year positive rate of 105.1 percent from $33.13 million. This was brought about by the bulk order of camera parts.
Ignition wiring set and other wiring sets used in vehicles, aircrafts and ships (consists only of electrical wiring harness for motor vehicles), ranked fourth with total revenue of $52.03 million reflecting a 12.4 percent increase from $46.30 million during the same period of 2004.
Revenue from petroleum products grew by 87.2 percent to $50.12 million from $26.78 million. This was brought about by the exportations made on petroleum naphtha and fuel and lubricating oils.
Rounding up the list of the top exports for the month of June 2005 were: coconut oil, $44.26 million; cathodes and sections of cathodes, of refined copper, $38.49 million; woodcrafts and furniture, $35.87 million; metal components $32.56 million; and bananas (fresh), 30.80 million.
Total receipts for the top ten exports reached $2.712 billion, or 80.9 percent of the total exports.
Fig. 1 Philippine Top Exports: June 2004 and 2005
(F.O.B. Value in Million US Dollars)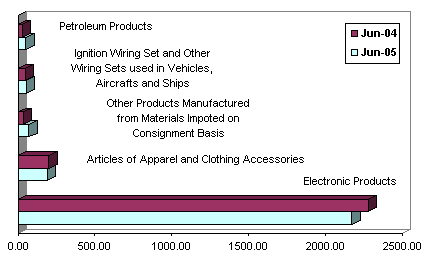
Exports of manufactured goods down by 0.3 percent
Accounting for 89.3 percent of the total receipts, exports of manufactured goods was $2.993 billion a drop of 0.3 percent from $3.002 billion during the same period of 2004.
Earnings from all agro-based products combined for $153.11 million or 4.6 percent of the total export revenue. Compared to last year, aggregate receipt for this commodity group went up by 10.6 percent from $138.38 million. Values of exports of copra meal, centrifugal and refined sugar, canned pineapple and coffee, raw not roasted were recorded during the month.
Income from special transactions declined by 17.6 percent to $78.04 million from $94.76 million while receipts from exports of mineral products increased by 40.9 percent to $76.26 million from $54.13 million.
Petroleum products registered earnings of $50.12 million, while forest products posted $1.79 million.
Fig. 2 Philippine Exports by Commodity Group: June 2004 and 2005
(F.O.B. Value in Million US Dollars)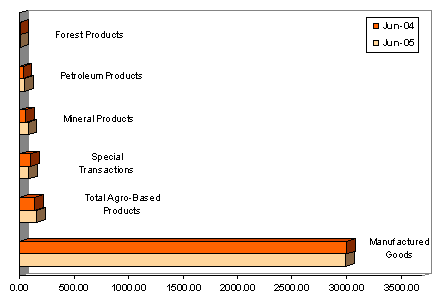
Exports to United States account for 17.0 percent
Accounting for 17.0 percent of the country's aggregate income for the month, exports to United States was valued at $569.60 million. Receipts slightly dropped by 1.2 percent from last year's reported figure of $576.47 million.
Japan followed with a 15.4 percent share. Earnings at $515.47 million, fell by 24.5 percent from $682.32 million.
People's Republic of China emerged as the third biggest market for the month as shipments of local goods amounted to $372.62 million or 11.1 percent of the total. Receipts went up by 79.8 percent from $207.20 million during to the same period of 2004.
Exports to Netherlands accounting for 9.7 percent of the total receipts was worth $325.86 million, a 26.3 percent increase from $257.94 million during the same month a year ago.
Other top markets for June 2005 were: Hong Kong, with exports worth $302.05 million; Malaysia, $233.43 million; Singapore, $195.26 million; Taiwan, $150.85 million; Republic of Korea, $116.35 million; and Germany, $113.79 million.
Total export receipts from RP's top ten markets for the month of June amounted to $2.895 billion or 86.4 percent of the total.
Fig. 3 Philippine Top Exports by Country: June 2005
(F.O.B. Value in Million US Dollars)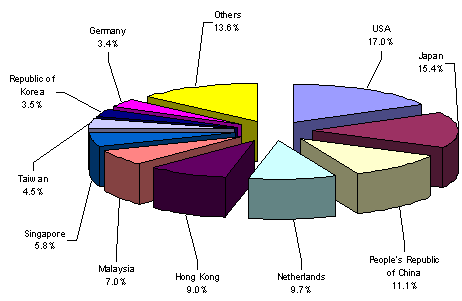
|
(Sgd.) CARMELITA N. ERICTA |
Source: Economic Indices and Indicators Division
Industry and Trade Statistics Department
National Statistics Office
Manila, Philippines
| Attachment | Size |
|---|---|
|
|
9.94 KB |
|
|
8.62 KB |
|
|
12.76 KB |
|
|
11.02 KB |
|
|
5.72 KB |