
MERCHANDISE EXPORTS PERFORMANCE
JUNE 2016
(Preliminary)
|
|
June
|
||
|---|---|---|---|
|
|
2016 p |
2015 r |
|
|
TOTAL EXPORTS FOB Value in Million US Dollars Year-on-Year Growth (Percent) Electronic Products FOB Value in Million US Dollars Year-on-Year Growth (Percent) |
4,754.42 -11.4
2,429.11 -5.1 |
5,363.96 -1.8
2,558.43 14.9 |
|
|
Top 10 Philippine Exports to All Countries: June 2016 p
(Year-on-Year Growth in Percent)
|
|||
|---|---|---|---|
Gainer |
Losers |
||
|
Miscellaneous Manufactured Articles, n.e.s.
|
137.7 |
Other Mineral Products
|
-41.1 |
|
|
Machinery and Transport Equipment
|
-31.6 | |
|
|
Other Manufactures
|
-26.1 | |
|
|
Chemicals
|
-25.7 | |
|
|
Woodcrafts and Furniture
|
-19.2 | |
|
Ignition Wiring Set and Other Wiring Sets Used in Vehicles, Aircrafts and Ships
|
-10.2 | ||
|
Electronic Products
|
-5.1 | ||
|
Metal Components
|
-2.2 | ||
|
Coconut Oil
|
-2.0 | ||
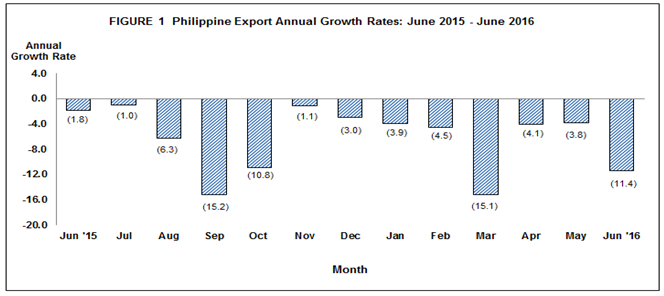
EXPORTED GOODS DECREASE BY 11.4 PERCENT IN JUNE 2016
The Philippines’ export sales amounted to $4.754 billion in June 2016, an 11.4 percent decrease from $5.364 billion recorded value in June 2015. The decrease was attributed to nine major commodities out of the top ten export commodities for the month. These include other mineral products (-41.1%); machinery and transport equipment (-31.6%); other manufactures (-26.1%); chemicals (-25.7%); woodcrafts and furniture (-19.2%); ignition wiring set and other wiring sets used in vehicles, aircrafts and ships (-10.2%); electronic products (-5.1%); metal components (-2.2%); and coconut oil (-2.0%) (Table 1).
Furthermore, total merchandise exports for the period January to June 2016 registered a 7.5 percent decrease from $29.002 billion in 2015 to $26.832 billion in the same period of 2016 (Table 1a).
EXPORTS OF ELECTRONIC PRODUCTS WENT DOWN BY 5.1 PERCENT
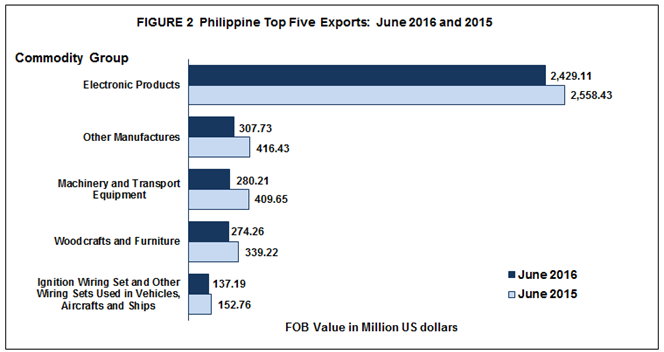
Electronic Products remained as the country’s top export with total receipts of $2.429 billion, accounting for 51.1 percent of the total exports revenue in June 2016. It went down by 5.1 percent from $2.558 billion registered in June 2015. Components/Devices (Semiconductors), with the biggest share of 36.1 percent among electronic products, however, decreased by 8.7 percent from $1.880 billion in June 2015 to $1.715 billion in June 2016.
Other Manufactures ranked second at $307.73 million or 6.5 percent share to the total export receipts. It recorded a decrease of 26.1 percent from June 2015 value of $416.43 million.
Machinery and Transport Equipment was the third top export earner in June 2016 with export revenue of $280.21 million. Export sales for this commodity group fell by 31.6 percent from $409.65 million in June 2015.
Woodcrafts and Furniture ranked fourth, with a contribution of 5.8 percent share to the total export receipts, recording sales of $274.26 million in June 2016. It registered a 19.2 percent decrease from the previous year level of $339.22 million.
Ignition Wiring Set and Other Wiring Sets Used in Vehicles, Aircrafts and Ships was recorded as the country’s fifth top export earner with value at $137.19 million or 2.9 percent share to total exports. It went down by 10.2 percent from $152.76 million in same period of 2015.
Rounding up the list of the top ten exports with corresponding export sales for the month of June 2016 were:
- Other Mineral Products with $115.61 million, dropped by 41.1 percent.
- Coconut Oil with $104.98 million, decreased by 2.0 percent;
- Metal Components with $96.91 million, fell by 2.2 percent;
- Miscellaneous Manufactured Articles, n.e.s with $93.10 million, rose by 137.7 percent; and
- Chemicals with $92.21 million, decelerated by 25.7 percent;
Total receipts from the top ten exports decreased by 11.5 percent in 2016 and reached $3.931 billion or 82.7 percent of the total exports.
EXPORTS OF MANUFACTURED GOODS DECREASE BY 9.5 PERCENT
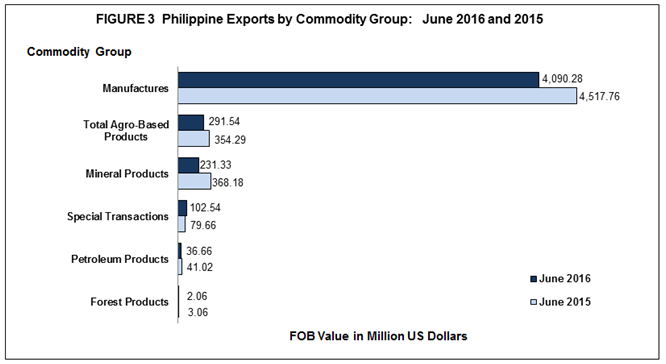
Outward shipments of Manufactured Goods were valued at $4.090 billion, accounting for 86.0 percent of the total export receipts in June 2016. It recorded a decreased by 9.5 percent from $4.518 billion recorded in June 2015 (Table 2).
Exports from Total Agro-Based Products, with a 6.1 percent share to total exports in June 2016, amounted to $291.54 million. It reduced by 17.7 percent from $354.29 million in June 2015.
Merchandise exports from Mineral Products, which shared 4.9 percent of the total exports revenue, moved down by 37.2 percent from $368.18 million in June 2015 to $231.33 million in June 2016.
Special Transactions with a 2.2 percent share to total exports, increased by 28.7 percent to $102.54 million in June 2016 from $79.66 million in June 2015.
Petroleum Products, with 0.8 percent share, declined by 10.6 percent from $41.02 million in June 2015 to $36.66 million in the same month in 2016.
Moreover, sales from Forest Products, accounting for less than 0.1 percent share of the total exports, decreased by 32.6 percent from $3.06 million in June 2015 to $2.06 million in same period of 2016.
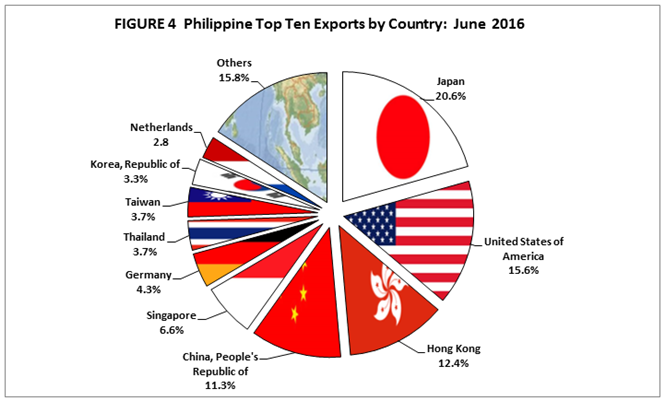
JAPAN ACCOUNTS FOR 20.6 PERCENT OF THE TOTAL EXPORTS IN JUNE 2016
Total export receipts from the country’s top ten market destinations for the month of June 2016 was valued at $4.002 billion, accounting for 84.2 percent share of the total export receipts (Table 3). See Figure 4.
Japan including Okinawa remained as the country’s top export destination with revenue amounting to $980.57 million, comprising 20.6 percent share to total exports for June 2016. It decreased by 23.2 percent from $1.277 billion recorded in the same month a year ago.
United States of America (USA) including Alaska and Hawaii ranked second, accounting 15.6 percent of total exports, with receipts valued at $741.00 million in June 2016. It recorded a decrease of 0.7 percent from $746.16 million in same month last year.
Hong Kong ranked third with $589.36 million or 12.4 percent share of the total exports. It grew by 3.2 percent from $571.16 million recorded in the same month last year.
People’s Republic of China with 11.3 percent share to total exports, ranked fourth with shipments valued at $536.14 million. It went down by 14.0 percent from $623.74 million in same month a year ago.
Singapore placed fifth, representing a 6.6 percent share to total exports, with export earnings worth $315.51 million. It decelerated by 1.1 percent from $318.88 million posted in June 2015.
Other top ten market destinations for June 2016 were: Germany, $203.00 million; Taiwan, $175.29 million; Thailand, $174.63 million; Republic of Korea, $154.60 million; and Netherlands, $131.63 million.
Exports to Other Countries which was valued at $752.68 million accounted for 15.8 percent of the total exports for the month of June 2016. Among the Other Countries, Malaysia including Sabah and Sarawak recorded the highest at $99.80 million or 2.1 percent of the total exports.
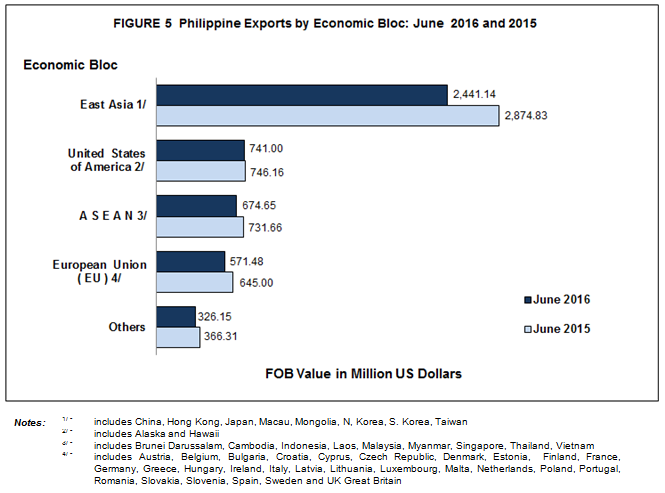
MORE THAN 50 PERCENT OF EXPORTS ARE FOR COUNTRIES IN EAST ASIA
Majority of the country’s merchandise exports in June 2016 went to countries in East Asia, accounting for 51.3 percent share to total exports valued at $2.441 billion. It decreased by 15.1 percent from $2.875 billion of June 2015.
Commodities exported to ASEAN member countries comprised 14.2 percent of the total exports in June 2016 and was valued at $674.65 million. This registered a decrease of 7.8 percent from $731.66 million posted in same month a year ago.
Exports to European Union member countries, with 12.0 percent share to total merchandise exports amounted to $571.48 million. It recorded a 11.4 percent decrement from $645.00 million recorded in June 2015 (Table 3a).
Technical Notes
Export trade statistics are compiled by the Philippine Statistics Authority (PSA) from copies of export declarations filed with the Bureau of Customs (BOC) by exporters or their authorized representatives as required by law. PSA collects a copy of the accomplished form Export Declaration (ED – DTI form). Aside from the hard copy of the ED, the output of the Automated Export Documentation System (AEDS) is being utilized to generate export statistics. AEDS is a paperless transaction in lieu of the manual filling-up of export documents. The digitized copy of the AEDS is provided by BOC and PEZA to PSA on a monthly basis through email.
All documents (hard copies and e-files) received before the cut-off date which is every 25th day of the month are compiled, processed and generated in a monthly statistical tables for the preparation of Press Release. All documents received after the cut-off date, however, are processed and included in the generation of the revised statistical tables. Processing includes coding, editing, review and validation. Revised statistical tables are made available 10 to 15 working days after the press release date.
The Press Release is due every 10th day of each month. However, if the 10th day falls on a Saturday, release will be on Friday but if it falls on a Sunday or Monday the release will be on Tuesday. If the release date falls on holiday, the date of release is moved accordingly.
The 2004 Philippine Standard Commodity Classification (PSCC) is used to classify the commodities at the most detailed level for statistical purposes.
Data request of international merchandise trade statistics are available at Philippine Statistics Authority, Economic Sector Statistics Service, Trade Statistics Division (Telephone Number: 376-19-75).
FOR THE NATIONAL STATISTICIAN: