
| |||||||||||||||||||||||||||||||||||||||||||||||
Top 10 Philippine Exports for All Countries: March 2007 p | |||
Gainers | Losers | ||
Woodcrafts and Furniture | 110.0 | Coconut Oil | -62.8 |
Cathodes and Sections of Cathodes of Refined Copper | 76.1 | Petroleum Products | -42.1 |
Ignition Wiring Set and Other Wiring Sets Used in Vehicles, Aircrafts and Ships | 15.1 | Bananas (Fresh) | -11.5 |
Other Products Manufactured from Materials Imported on Consignment Basis | 10.6 | Articles of Apparel and Clothing Accessories | -5.0 |
Electronic Products | 9.6 | Metal Components | -0.3 |
|
|
|
|
* Includes transactions that passed through Automated Export Documentation System (AEDS).
p - preliminary
r - revised
MARCH 2007 MERCHANDISE EXPORTS INCREASE BY 10.6 PERCENT
Export earnings in March 2007 inched up by 10.6 percent to $4.566 billion from $4.127 billion in March 2006. Receipts from merchandise exports during January to March, on the other hand, rose by 13.1 percent to $12.270 billion from $10.847 billion during the same three-month period in 2006.
ELECTRONIC PRODUCTS GREW BY 9.6 PERCENT
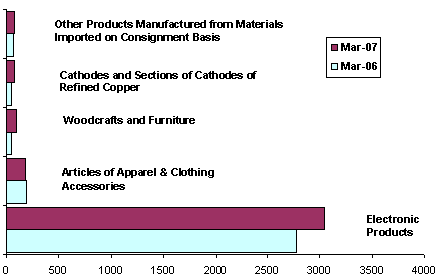
Accounting for 66.6 percent of the aggregate export revenue in March, Electronic Products went up by 9.6 percent to $3.043 billion from $2.777 billion in March 2006. Other electronic products that showed year-on-year increases are Components/Devices (Semiconductor) at 14.1 percent with a share of 53.8 percent; Office Equipment at 171.0 percent with a share of 0.7 percent;Communication/Radar at 70.8 percent with a share of 0.6 percent; and Control and Instrumentation at 125.1 percent with a share of 0.1 percent. Export receipts of the Electronic Products for January to March, on the other hand, rose by 13.7 percent to $7.955 billion from $6.995 billion during the same three-month period in 2006.
Articles of Apparel and Clothing Accessories continued to be the countrys second top earner with a combined share of 4.0 percent and an aggregate receipt of $184.24 million or 5.0 percent lower than $194.00 million in March 2006.
Woodcrafts and Furniture, ranked third with export receipts of $97.30 million or a year-on-year growth of 110.0 percent from $46.34 million in March 2006.
Cathodes and Sections of Cathodes of Refined Copper, ranked fourth with total revenue of $78.24 million reflecting a 76.1 percent climb from $44.4 million in March 2006.
Other Products Manufactured from Materials Imported on Consignment Basis, ranked fifth with sales amounting to $77.72 million or a growth of 10.6 percent from $70.25 million in March 2006.
Rounding up the list of the top exports for the month of March 2007 were, Ignition Wiring Set and Other Wiring Sets Used in Vehicles, Aircrafts and Ships (consisted only of electrical wiring harness for motor vehicles), $73.07 million or an annual growth of 15.1 percent;Petroleum Products with an export value of $52.26 million, down by 42.1 percent; Metal Components, $43.66 million or a decrease of 0.3 percent; Bananas (Fresh) with proceeds billed at $30.16 million or a decline of 11.5 percent; and Coconut Oil, with export revenue of $25.73 million or 62.8 percent decline from the same month in 2006.
Total receipts from the top ten exports reached $3.705 billion, or 81.2 percent of the total exports.
Fig. 1 Philippine Top Exports: March 2007 and 2006
(F.O.B. Value in Million US Dollars)
EXPORTS OF MANUFACTURED GOODS UP BY 11.3 PERCENT
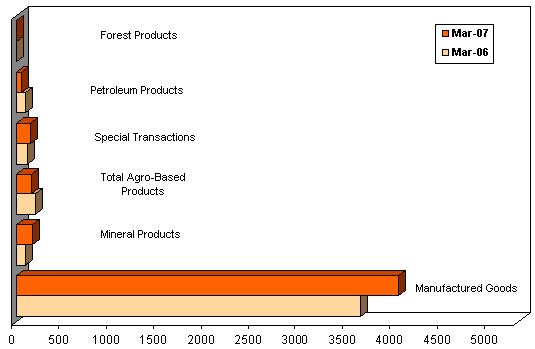
Accounting for 88.5 percent of the total receipts, export of Manufactured Goods was $4.039 billion or an 11.3 percent growth from $3.630 billion in March 2006.
Earnings from Mineral Products reached $164.50 million or 3.6 percent of the total export revenue, a growth of 77.1 percent from $92.87 million recorded in March 2006.
Income from All Agro-Based Products shrank by 21.9 percent to $155.12 million from $194.48 million, while receipts from exports of the Special Transactions inched-up by 33.6 percent to $151.29 million from $113.22 million.
Petroleum Products, on the other hand, continued to record a decline of 42.1 percent to $52.26 million from $90.31 million in March 2006. Meanwhile, exports revenue of Forest Products went up by 34.4 percent to $3.38 million from $2.52 million recorded in March 2006. Inflows of receipts during January to March for Forest Products likewise registered a growth of 131.7 percent to $10.72 million from $4.63 million during the same three-month period in 2006.
Fig. 2 Philippine Exports by Commodity Group: March 2007 and 2006
(F.O.B. Value in Million US Dollars)
EXPORTS TO UNITED STATES ACCOUNT FOR 14.8 PERCENT
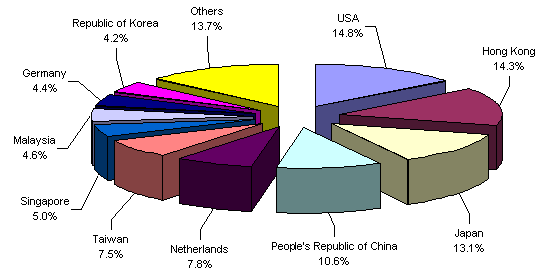
United States of America (USA) remained to be the top market of the country for March with export receipts of $676.23 million, accounting for 14.8 percent of the countrys aggregate income for the month. However, receipts went down by 4.0 percent from $704.21 million reported in March 2006.
Hong Kong followed with earnings of $653.89 million or a 14.3 percent share of the total exports for the month which resulted to a strong growth of 135.0 percent from $278.30 million recorded in March 2006.
Japan emerged as the third biggest market for the month with shipments amounting to $599.04 million or 13.1 percent of the total, a decline of 8.6 percent from a year ago level of $655.53 million.
Peoples Republic of China, with $484.94 million or 10.6 percent of the total revenue, reflected a 21.0 percent increase from $400.67 million in March 2006.
Other top markets for March 2006 were Netherlands, $356.94 million; Taiwan, $342.61 million;Singapore, $228.13 million; Malaysia, $208.15 million; Germany, $199.82 million; andRepublic of Korea, $189.94 million.
Total export receipts from RPs top ten markets for the month of March 2007 amounted to $3.940 billion or 86.3 percent of the total.
Fig. 3 Philippine Exports by Top Markets : March 2007
(F.O.B. Value in Million US Dollars)
Technical Note:
Starting with the January 2007 Press Release, analysis and tables are based on the 2004 Philippine Standard Commodity Classification (PSCC) groupings. This is in compliance with NSCB Resolution No. 03, Series of 2005 entitled "Approving and Adopting the 2004 Philippine Standard Commodity Classification" by all concerned government agencies and instrumentalities.
(Sgd.) CARMELITA N. ERICTA |
Source: Foreign Trade Statistics Section
Industry and Trade Statistics Department
National Statistics Office
Manila, Philippines