
MERCHANDISE EXPORT PERFORMANCE *
March 2010
( Preliminary )
* Includes transactions that passed through Automated Export Documentation System (AEDS).
p - preliminary
r - revised
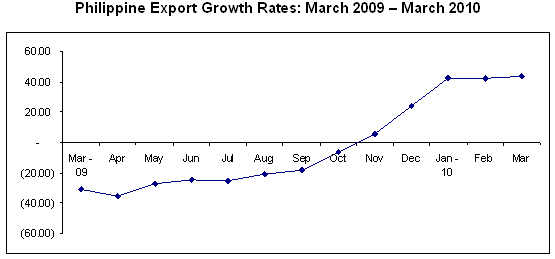
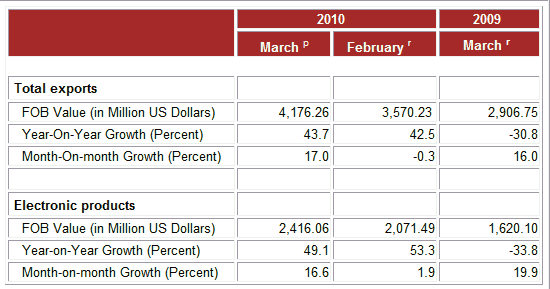
MARCH 2010 MERCHANDISE EXPORTS UP BY 43.7 PERCENT
Export earnings in March 2010 amounted to $4.176 billion, registering a double-digit growth of 43.7 percent from it�s year ago level of $2.907 billion. The same is true with it�s previous month level which rose by 17.0 percent from $3.570 billion in February 2010. Aggregate merchandise exports for the first quarter of 2010 also showed an increase of 42.9 percent to $11.326 billion from $7.926 billion posted during the same three-month period in 2009.
ELECTRONIC PRODUCTS INCREASED BY 49.1 PERCENT
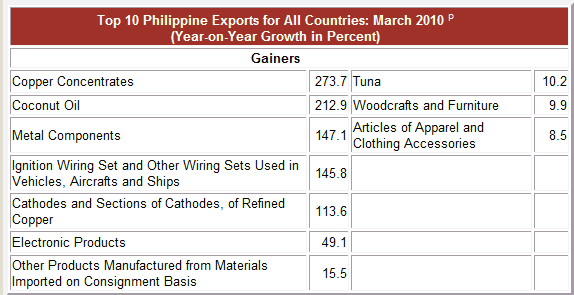
Accounting for 57.9 percent of the total export revenue in March 2010, Electronic Products was the country�s top export with a total earnings of $2.416 billion. It grew by 49.1 percent from $1.620 billion in March 2009. Components/Devices (Semiconductors) which comprised 41.9 percent of the total exports and the biggest share among the major groups of electronic products amounted to $1.749 billion or an annual growth of 49.1 percent. Month-on-month, Electronic Products went up by 16.6 percent from $2.071 billion in February 2010.
Articles of Apparel and Clothing Accessories which comprised 3.5 percent share of total exports in March 2010 emerged as RP�s second top gainer with revenue valued at $146.07 million. This commodity group likewise exhibited year-on-year expansion of 8.5 percent from $134.63 million in March 2009.
Cathodes and Sections of Cathodes, of Refined Copper followed as the third top earner in March 2010 with total export earnings of $111.53 million or a share of 2.7 percent to the total export receipts. It grew by 113.6 percent from $52.21 million in March 2009.
Ranked fourth in March 2010 and contributing 2.5 percent to the total export receipts was Coconut Oil (including crude and refined) with revenue amounting to $102.83 million. This value was up by 212.9 percent from its year ago level of $32.86 million.
Ignition Wiring Set and Other Wiring Sets Used in Vehicles, Aircrafts and Ships (consisting only of electrical wiring harness for motor vehicles) with 2.4 percent share to the total export receipts ranked fifth with value posted at $97.94 million or 145.8 percent increase from $39.84 million registered in March 2009.
Rounding up the list of the top ten exports for the month of March 2010 were Wood crafts and Furniture with export earnings of $94.33 million up by 9.9 percent; Metal Components (excluding brakes and servo - brakes) with export receipts of $75.98 million gained by 147.1 percent; Other Products Manufactured from Materials Imported on Consignment Basis with export revenue of $59.18 million expanded by 15.5 percent; Tuna (includes fresh, frozen, prepared or preserved in airtight containers) with proceeds billed at $32.49 million grew by 10.2 percent; and Copper Concentrates recorded sales amounting to $31.06 million accelerated by 273.7 percent, the highest increase among the top ten exports in March 2010.
Total receipts from the top ten exports reached $3.167 billion, or 75.8 percent of the total exports.
Fig. 1 Philippine Top Five Exports: March 2010 and 2009
(F.O.B. Value in Million US Dollars)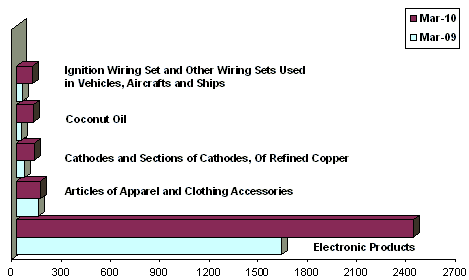
EXPORTS OF MANUFACTURED GOODS STOOD AT $3.601 BILLION
Accounting for 86.2 percent of the total receipts, outward shipments of Manufactured Goods in March 2010 reached $3.601 billion or a 43.6 percent increase from $2.507 billion recorded in the same period a year earlier. Month-on-month, it rose by 15.1 percent from $3.129 billion recorded in February 2010.
Income from Total Agro-Based Products comprising 5.4 percent of the total exports revenue in March 2010 went up by 49.7 percent to $225.83 million in March 2010 from $150.88 million in March 2009. Compared to its previous month level, it was higher by 21.7 percent from $185.59 million posted in February 2010.
Earnings from Mineral Products with a share of 4.7 percent in March 2010 reached $196.71 million. It grew by 56.1 percent from $126.06 million in March 2009. Similarly, export receipts from Special Transactions reflecting 3.2 percent share expanded by 17.9 percent to $133.16 million from $112.90 million recorded in March 2009.
Exports revenue of Petroleum Products with 0.4 percent share of the total exports accelerated by 134.5 percent to $18.40 million from $7.84 million in March 2009. However, Forest Products with less than 0.1 percent share of the total exports contracted by 39.8 percent from $2.33 million registered in March 2009 to $1.40 million in March 2010.
Fig. 2 Philippine Exports by Commodity Group: March 2010 and 2009
(F.O.B. Value in Million US Dollars)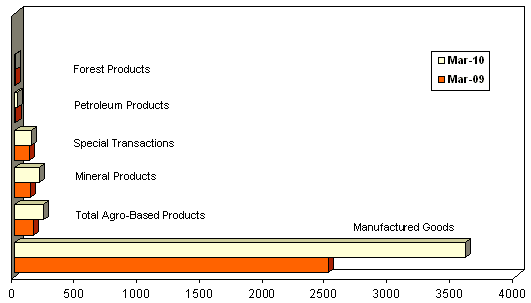
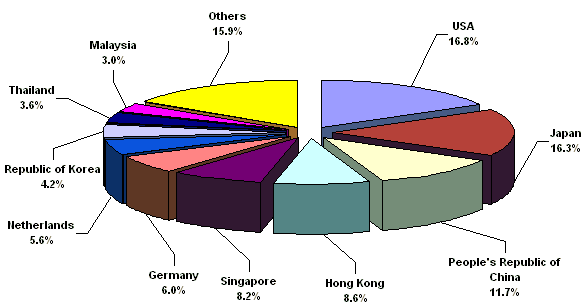
EXPORTS TO UNITED STATES ACCOUNTED FOR 16.8 PERCENT
United States of America (USA) including Alaska and Hawaii comprising 16.8 percent of the total exports for March 2010, emerged as the country�s top destination of exports for March 2010 with revenue amounting to $703.32 million. It was higher by 39.8 percent from $503.04 million recorded a year ago.
Japan including Okinawa followed as the second top market of the country for March 2010 with export earnings of $682.49 million or 16.3 percent share of the total exports. The amount increased by 52.8 percent from $446.56 million reported a year earlier.
People's Republic of China representing an 11.7 percent of the total exports came in third with shipments amounting to $487.32 million. Compared to its March 2009 level, the amount expanded by 58.2 percent from $308.03 million.
Hong Kong ranked fourth in March 2010 with $359.06 million or 8.6 percent share of the total exports, advanced by 31.6 percent from it�s March 2009 level of $272.79 million.
Fifth in rank and accounting for 8.2 percent share of the total exports was Singapore with export earnings worth $343.80 million or an increase of 166.1 percent from $129.22 million posted in March 2009.
Other top ten markets for March 2010 were Germany, $251.47 million; Netherlands, $233.70 million; Republic of Korea, $175.48 million; Thailand, $148.48 million; and Malaysia, $127.10 million.
Total export receipts from RP�s top ten markets for the month of March 2010 amounted to $3.512 billion or 84.1 percent of the total.
Fig. 3 Philippine Top Exports by Country: March 2010
(F.O.B. Value in Million US Dollars)
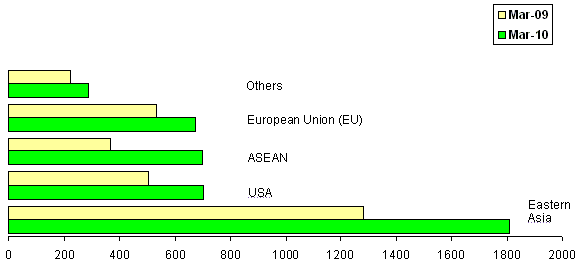
EXPORTS FROM EASTERN ASIA WORTH $1.810 BILLION
Philippines total exports in March 2010 to Eastern Asia (China, Hong Kong, Japan, Macau, Mongolia, North Korea, South Korea and Taiwan) accounted for 43.3 percent of the county�s total exports. It amounted to $1.810 billion or an increase of 41.2 percent from it�s March 2009 level of $1.282 billion.
Exports to ASEAN member-countries representing 16.8 percent share of the total exports in March 2010 worth $700.77 million, an annual positive growth of 91.0 percent from $366.85 million recorded in March 2009.
March 2010 total exports to European Union (EU) with a 16.1 percent contribution to total exports were valued at $674.23 million. It expanded by 26.8 percent from $531.91 million registered in March 2009.
Fig. 4 Philippine Exports by Selected Economic Bloc: March 2010 & 2009
(F.O.B. Value in Million US Dollars)
Technical Note:
Starting with the January 2007 Press Release, analysis and tables are based on the 2004 Philippine Standard Commodity Classification (PSCC) groupings (as amended in 1999). This is in compliance with NSCB Resolution No. 03, Series of 2005 entitled "Approving and Adopting the 2004 Philippine Standard Commodity Classification" by all concerned government agencies and instrumentalities.
(Sgd.) CARMELITA N. ERICTA
Administrator
Source: Foreign Trade Statistics Section
Industry and Trade Statistics Department
National Statistics Office
Manila, Philippines