
MERCHANDISE EXPORT PERFORMANCE*
May 2013
(Preliminary)

* Include transactions that passed through Automated Export Documentation System (AEDS).
p - preliminary
r - revised
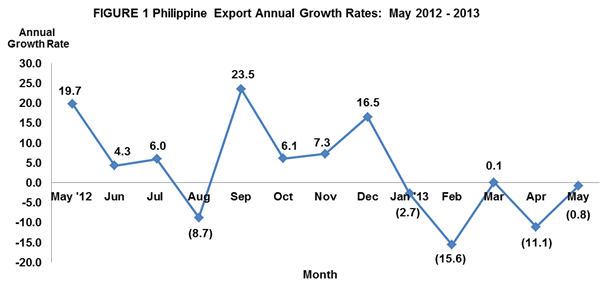
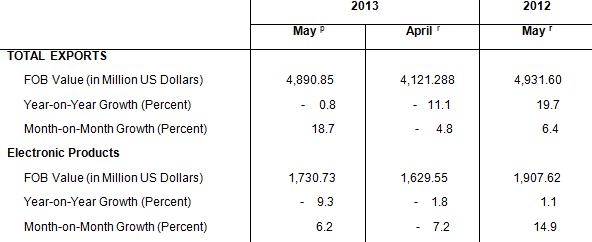
MERCHANDISE EXPORTS FOR MAY 2013 DOWN BY 0.8 PERCENT
Export earnings in May 2013 amounted to $4.891 billion, a 0.8 percent decrement from $4.932 billion recorded in May of 2012. However, on a monthly basis, it grew by 18.7 percent from $4.121 billion posted in April 2013. The negative growth was supported by five major commodities out of the top ten commodities for the month. These are machinery and transport equipment, ignition wiring set and other wiring sets used in vehicles, aircrafts and ships, articles of apparel and clothing accessories, electronic products and metal components. Aggregate merchandise exports for the first five months of 2013 showed a decrease of 6.0 percent from $22.445 billion in 2012 to $21.093 billion in 2013.
ELECTRONIC PRODUCTS DECREASES BY 9.3 PERCENT
Accounting for 35.4 percent of the total exports revenue in May 2013, Electronic Products emerged as the country’s top export with total receipts of $1.731 billion. It went down by 9.3 percent from $1.908 billion registered in May 2012. On the other hand, month-on-month, Electronic Products was up by 6.2 percent from $1.630 billion posted in April 2013. Components/Devices (Semiconductors), which comprised 28.4 percent of the total exports shared the biggest among the major groups of electronic products with export earnings worth $1.390 billion or a decline of 1.9 percent from $1.417 billion registered in May 2012. Similarly, volume of outward shipments of electronic products and semiconductors also declined by 8.5 percent and 0.7 percent, respectively compared to same period a year ago.
Other Manufactures recorded as the country’s second top export with revenue valued at $396.42 million or 8.1 percent share to total exports. It increased by 36.5 percent compared to $290.32 million in same period a year ago. Furthermore, outward shipments of this product showed an expansion of 17.4 percent compared to its year ago recorded shipment.
Ranked third in May 2013 and contributing 7.0 percent share to the total export receipts was Machinery and Transport Equipment with earnings amounting to $343.85 million. This figure contracted by 40.4 percent from its year ago level of $577.09 million. Likewise, outward shipment expanded by 966.0 percent compared to same period last year.
Other Mineral Products, with 6.8 percent share to the total export receipts, ranked fourth with value posted at $332.14 million. It rose by 189.5 percent from $114.72 million recorded value during the same month in 2012. Furthermore, volume of shipments of this commodity showed a 118.9 percent increase compared to last year same month period.
Woodcrafts and Furniture with export revenue of $306.92 million, up by 74.7 percent followed as the fifth top export earner in May 2013. Moreover, volume of this product grew by 79.8 percent compared to the same period last year.
Rounding up the list of the top ten exports for the month of May 2013 were Chemicals with export earnings of $229.26 million, up by 48.0 percent; Metal Components with export receipts of $138.07 million lower by 1.1 percent; Petroleum Products registering the highest year-on-year change of 521.3 percent among the top ten exports with recorded sales amounting to $129.66 million; Articles of Apparel and Clothing Accessories with proceeds billed at $128.51 million falling by 14.7 percent; and Ignition Wiring Set and Other Wiring Sets Used in Vehicles, Aircrafts and Ships Oil consists only of electrical wiring harness for motor vehicles with total receipts of $109.00 million declining by 15.4 percent compare to same period a year ago.
Total receipts from the top ten exports reached $3.845 billion, or 78.6 percent of the total exports.

EXPORTS OF MANUFACT URED GOODS STAND AT $3.782 BILLION
Accounting for 77.3 percent of the total export receipts in May 2013, outward shipments of Manufactured Goods was estimated at $3.782 billion, representing a decrease of 10.6 percent from $4.229 billion recorded in May 2012. On the other hand, on a monthly basis, it went up by 11.3 percent from $3.396 billion recorded in April 2013. Outward shipments in terms of gross kilos showed a positive year-on-year change of 30.4 percent compared with shipment in May 2012 and 69.2 percent increase in volume of shipment compared with last month.
Income from Total Agro-Based Products comprising 7.7 percent share of the total exports revenue in May 2013, went up by 13.4 percent to $374.50 million from $330.31 million. Compared to its previous month level, it rose by 20.3 percent from $311.27 million in April 2013. Likewise, volume of shipments grew by 16.2 percent compared to same month a year ago.
Earnings from Mineral Products, with a share of 10.0 percent in May 2013, reached $490.96 million. It inflated by 136.8 percent from $207.33 million in May 2012. Furthermore, recorded volume of outward shipments for mineral products registered a positive growth of 105.1 percent compared to last year’s outward shipments.
Petroleum Products accounting for 2.7 percent share of the total exports revenue expanded by 521.3 percent to $129.66 million from $20.87 million reported value a year ago. Similarly, recorded volume of this product rose by 672.0 percent compared to same month in 2012. On the contrary, export receipts from Special Transactions, reflecting 1.8 percent share, declined by 38.4 percent from $140.37 million in May 2012 to $86.53 million in May 2013. Furthermore, outward shipments fell by 41.9 percent compared to same month a year ago.
Forest Products with 0.6 percent share grew by 733.3 percent to $27.44 million in May 2013 from $3.29 million in May 2012. Also, outward shipments of this product in terms of gross kilos were up by 72.7 percent compared to last year’s recorded volume.

JAPAN ACCOUNTS FOR 20.1 PERCENT
Japan including Okinawa, comprising 20.1 percent share to total exports for May 2013, emerged as the country’s top destination of exports with revenue amounting to $982.29 million. It was lower by 13.3 percent from $1.133 billion recorded a year ago. Woodcrafts, other mineral products and components/devices (semiconductors) are the goods mostly exported to Japan.
United States of America (USA) including Alaska and Hawaii, accounting for 12.4 percent share to total exports followed as the second top market of the country for May 2013 with export earnings worth $607.06 million. This represents a decrease of 15.0 percent from $714.11 million reported a year earlier. Products exported to USA comprised mostly components/devices (semiconductors).
People’s Republic of China, with 11.7 percent share to total exports, came in third with shipments amounting to $571.99 million. Compared to same month a year ago, this value expanded by 2.0 percent from $560.64 million. The export items to China consist mainly of components/devices (semiconductors) and other mineral products.
Singapore ranked fourth in May 2013 with $414.47 million or 8.5 percent share of the total exports which increased by 22.5 percent from its year ago amount of $338.39 million. Goods mostly exported to Singapore were components/devices (semiconductors) and petroleum products.
Fifth in rank and representing 7.7 percent share to total exports was Republic of Korea with export earnings worth $375.89 million or an increase of 164.2 percent from $142.29 million posted in May 2012. Other manufactures, components/devices (semiconductors) and mineral products were goods mostly exported to Korea.
Other top ten markets for May 2013 were Hong Kong, $359.61 million; Thailand, $268.61 million; Malaysia, $255.83 million; Netherlands, $162.95 million; and Germany, $130.85 million.
Total export receipts from the country’s top ten markets for the month of May 2013 amounted to $4.130 billion or 84.4 percent of the total.

EXPORTS TO EAST ASIA WORTH $2.421 BILLION
The merchandise exports of the Philippines to East Asia in May 2013 accounted 49.5 percent share to total exports, amounting to $2.421 billion or an increase of 4.2 percent from its May 2012 figure of $2.326 billion.
Exports to ASEAN member-countries, accounting for 21.5 percent share to total merchandise exports in May 2013, reached $1.053 billion, a 5.2 percent decline from $1.111 billion recorded in May 2012.
Merchandise exports to European Union (EU), on the other hand, sharing 10.6 percent to total merchandise exports in May 2013, was valued at $519.95 million. It expanded by 8.0 percent from $481.31 million posted in May 2012.

Notes:
1/ - includes China, Hong Kong, Japan, Macau, Mongolia, N, Korea, S. Korea, Taiwan
2/ - includes Brunei Darussalam, Cambodia, Indonesia, Laos, Malaysia, Myanmar, Singapore, Thailand, Vietnam
3/ - includes Alaska and Hawaii
4/ - includes Austria, Belgium, Bulgaria, Cyprus, Czech Republic, Denmark, Estonia, Finland, France, Germany, Greece,
Hungary, Ireland, Italy, Latvia, Lithuania, Luxembourg, Malta, Netherlands, Poland, Portugal, Romania, Slovakia,
Slovenia, Spain, Sweden and UK Great Britain
Technical Note:
Starting with the February 2007 Press Release, analysis and tables are based on the 2004 Philippine Standard Commodity Classification (PSCC) groupings. This is in compliance with NSCB Resolution No. 03, Series of 2005 entitled “Approving and Adopting the 2004 Philippine Standard Commodity Classification” by all concerned government agencies and instrumentalities.
CARMELITA N. ERICTA
Administrator
Source: Foreign Trade Statistics Section
Industry and Trade Statistics Department
National Statistics Office
Manila, Philippines