
Merchandise exports decrease by 4.9 percent
Registered export earnings for November 2003 went down by 4.9 percent to $2.952 billion from $3.103 billion during the same month a year ago.
Receipts from merchandise exports for January to November 2003 inched up by 0.5 percent to $32.441 billion from $32.294 billion during the same period of 2002.
Electronic products down by 10.3 percent
Electronic products, accounting for 68.2 percent of the aggregate export revenue for the month, registered a decrease of 10.3 percent to $2.012 billion from $2.244 billion last year. Among the major groups of electronic products,components/devices (Semiconductors) dominated the groupings with 44.0 percent share to total exports. It went down by 13.4 percent to $1.300 billion from $1.501 billion during the same period last year.
Articles of apparel and clothing accessories remained as the countrys second top earner with a combined share of 4.5 percent and an aggregate receipt of $132.82 million or 24.0 percent lower than $174.64 million a year earlier.
Other products manufactured from materials imported on consignments basis, ranked third with total revenue of $69.14 million reflecting a 92.4 percent increment from $35.94 million during the same period of 2002.
Ignition wiring set and other wiring sets used in vehicles, aircrafts and ships (consists only of electrical wiring harness for motor vehicles) ranked fourth with sales amounting to $47.89 million or a year-on-year growth of 13.7 percent from $42.11 million.
Revenue from petroleum products increased by 33.6 percent to $38.72 million from $28.98 million.
Rounding-up the list of the top exports for the month of November 2003 were:coconut oil, $35.64 million; bananas (fresh), $28.75 million; woodcrafts and furniture, $28.55 million; metal components, $24.07 million; andpineapple and pineapple products, $13.14 million.
Total receipts for the top ten exports reached $2.431 billion, or 82.4 percent of the total exports.
Fig. 1. Philippine Top Exports: November: 2002 and 2003
(F.O.B. Value in Million US Dollars)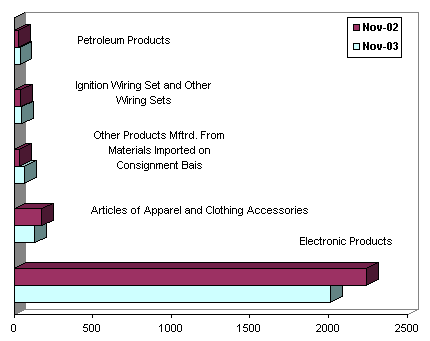
Manufactured goods decline by 6.4 percent
Accounting for 89.3 percent of the total receipts, exports of manufactured goods decreased by 6.4 percent as sales amounted to $2.637 billion, from $2.818 billion during the same month last year.
Income from all agro-based products, combined for $137.94 million or 4.7 percent of the total export revenue. Compared to last year, aggregate receipt for this commodity group accelerated by 16.5 percent from $118.38 million.
Special transactions were down by 4.2 percent to $106.55 million from $111.20 million, while receipt from exports of mineral products climbed by 25.7 percent to $31.40 million from $24.98 million.
Petroleum products contributed $38.72 million, while forest productsregistered earnings of $1.04 million dollars.
Fig. 2. Philippine Exports by Commodity Group: November: 2002 and 2003
(F.O.B. Value in Million US Dollars)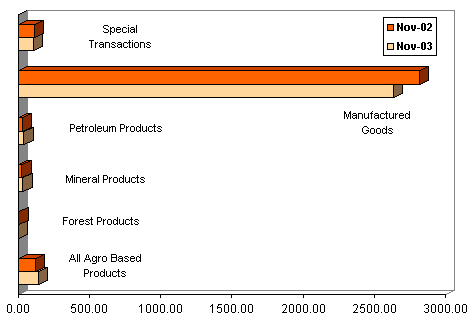
Exports to Japan account for 20.0 percent
Accounting for 20.0 percent of the countrys aggregate income for the month, exports to the Japan valued at $591.66 million, increased by 19.8 percent from last year's reported figure of $493.99 million.
U.S. followed with a 16.0 percent share. Valued at $473.47 million, exports to United States dropped by 28.9 percent from $665.50 million.
Netherlands, emerged as the third biggest market for the month as shipments of local goods amounted to $235.01 million or 8.0 percent of the total. Compared to the same period last year, receipts slightly grew by 0.2 percent from $234.48 million.
Hong Kong accounted for 7.6 percent of the total receipts, with $224.22 million reflecting a 15.8 percent decrease from $266.43 million during the same period a year earlier. Other top markets for November 2003 were:Taiwan, $215.59 million; Singapore, $212.50 million; Peoples Republic of China, $205.17 million; Malaysia, $156.44 million; Republic of Korea,$126.84 million; and Germany, $99.62 million.
Total export receipts from RPs top ten markets for the month of November amounted to $2.541 billion or 86.1 percent of the total.
Fig. 3. Philippine Top Exports by Country: November 2003
(F.O.B. Value in Million US Dollars)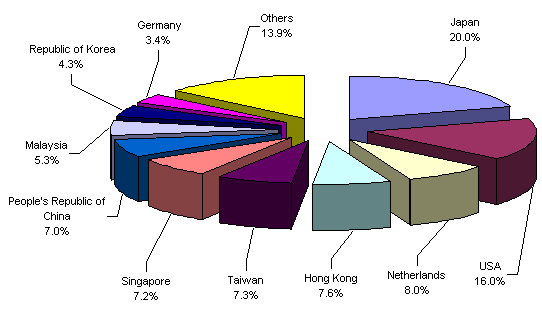
Source: Economic Indices and Indicators Division
Industry and Trade Statistics Department
National Statistics Office
Manila, Philippines
Page last revised: January 8, 2004