
MERCHANDISE EXPORT PERFORMANCE*
November 2012
(Preliminary)

* Include transactions that passed through Automated Export Documentation System (AEDS) and Electronic to Mobile (E2M).
p - preliminary
r - revised
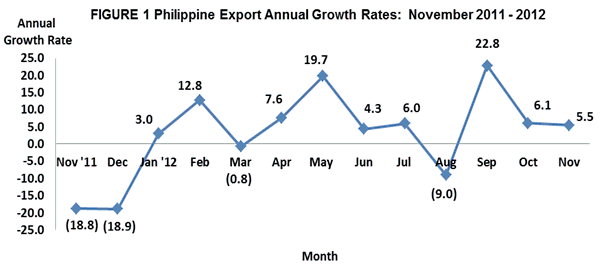
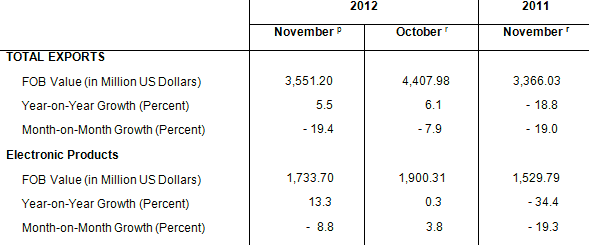
NOVEMBER MERCHANDISE EXPORTS INCREASE BY 5.5 PERCENT
Export earnings in November 2012 expanded by 5.5 percent to $3.551 billion from $3.366 billion recorded in November 2011. The growth was brought about by the increase in value of shipments of commodities such as metal components, woodcrafts and furniture, electronic products, cathodes & sections of cathodes, of refined copper and ignition wiring set, and other wiring sets used in vehicles, aircrafts, and ships. However, on a monthly basis, it contracted by 19.4 percent from $4.408 billion posted in October 2012. Likewise, cumulative merchandise exports for the first eleven months of 2012 recorded a positive growth of 7.0 percent to $48.026 billion from $44.898 billion posted during the same period of 2011. Meanwhile, total volume of outward shipments showed a year-on-year increase of 1.8 percent and a month-on-month decrease of 42.1 percent compared to same month last year and last month’s outward shipments, respectively.
ELECTRONIC PRODUCTS GROW BY 13.3 PERCENT
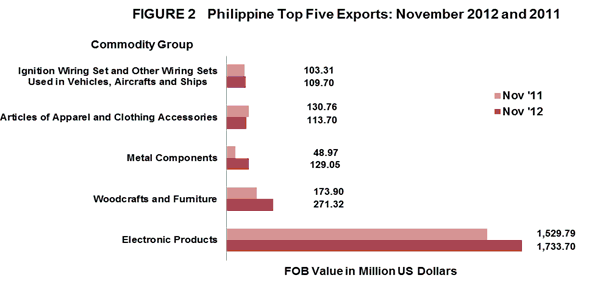
Electronic Products, accounting for 48.8 percent of the total exports revenue, emerged as the country’s top export with total receipts of $1.734 billion. It went up by 13.3 percent from $1.523 billion in November 2011. Similarly, outward shipments grew by 21.8 percent compared to same month last year’s recorded shipments. Components/Devices (Semiconductors) comprising 39.5 percent of the total exports, had the biggest share among the major groups of electronic products with export earnings worth $1.402 billion and registered an increase of 15.5 percent from $1.213 billion in November 2011. However on a monthly basis, electronic products as well as semiconductors showed downfall of 8.8 percent and 10.4 percent, respectively. Volume of outward shipments of semiconductors also declined by 4.8 percent compared to same period a year ago.
Woodcrafts and Furniture with 7.6 percent share to the total value of exports for November 2012 was recorded as the country’s second top export with revenue valued at $271.32 million. This figure exhibited a growth of 56.0 percent compared with its year ago level of $173.90 million. Likewise, volume of this product also grew by 42.5 percent compared to the same period last year.
Metal Components (excluding brakes & servo-brakes) followed as the third top export earner in November 2012 with total receipts of $129.05 million or a share of 3.6 percent to total exports revenue. It expanded by 163.5 percent, the highest annual increase among the top ten exports, compared with its year ago level of $48.97 million. Outward shipment of this product also showed an expansion of 394.8 percent compared to its year ago recorded shipment.
Ranked fourth in November 2012 and contributing 3.2 percent share to the total export receipts were Articles of Apparel and Clothing Accessories with earnings amounting to $113.70 million. It went down by 13.1 percent from $130.76 million registered in November 2011. Furthermore, volume of shipments of this commodity showed a 50.8 percent decrease compared to last year same month period.
Ignition Wiring Set and Other Wiring Sets Used in Vehicles, Aircrafts and Ships consisting only of electrical wiring harness for motor vehicles with 3.1 percent share to the total export receipts ranked fifth with value posted at $109.70 million. It increased by 6.2 percent from $103.31 million recorded in November 2011. Similarly, volume of outward shipments increased by almost 11.5 percent compared to it’s a year ago volume of shipment.
Rounding up the list of the top ten exports for the month of November 2012 were Cathodes $ Sections of Cathodes, of Refined Copper with export revenue of $71.56 million increasing by about 10.0 percent; Coconut Oil including crude and refined with export receipts of $42.90 million, losing by 27.1 percent; Gold (extracted from copper ores and concentrates) with export earnings of $36.29 million dropping by 32.3 percent; Pineapple and Pineapple Products with recorded sales of $28.79 million falling by 27.1 percent; and Bananas (fresh) with proceeds billed at $20.20 million trailing by 51.7 percent compared to same month last year.
Total receipts from the top ten exports reached $2.557 billion, or 72.0 percent of the total exports.
EXPORTS OF MANU
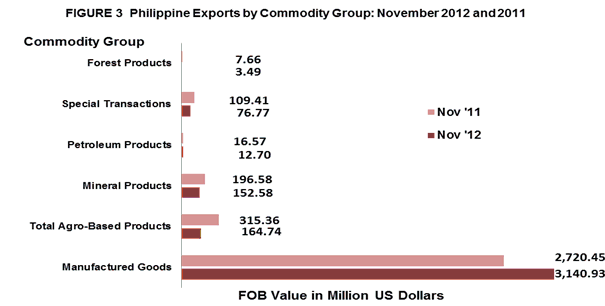
Accounting for 88.4 percent of the total export receipts in November 2012, value of outward shipments of Manufactured Goods was estimated at $3.141 billion, representing an increase of 15.5 percent from $2.720 billion recorded in November 2011. However, value went down by 11.3 percent compared to recorded value of about $3.540 billion in October 2012. On the other hand, outward shipments in terms of gross kilos showed a negative year-on-year change of 5.1 percent compared to shipment in November 2011 and a 35.3 percent decreased in volume of shipment compared to last month.
Income from Total Agro-Based Products, comprising 4.6 percent share of the total exports revenue in November 2012, went down by 47.8 percent from $315.36 million to $164.74 million. Similarly, it contracted by 55.1 percent from $367.15 million in October 2012. Also, this product showed a contraction in terms of volume with 18.4 percent year-on-year change and 36.7 percent month-on-month change. The downward trend was mainly due to the decrease in both the value and volume of export items such as sugar and other agro-based products.
Earnings from Mineral Products with a share of 4.3 percent reached $152.58 million. It fell by 22.4 percent from $196.58 million in November 2011. Export value of Special Transactions consisting of commodities like gifts, donations, machinery and equipment returned to the country, replacement of returned goods and the likes, reflecting 2.2 percent share, was lower by 29.8 percent from $109.41 million in November 2011 to $76.77 million in November 2012. However, volume of shipment of products categorized under special transactions, showed an increase of 414.8 percent compared to November 2011 recorded volume of outward shipments.
Forest Products accounting for 0.1 percent share of the total exports revenue decreased by 54.5 percent from $7.66 million a year ago to $3.49 million in November 2012. Moreover, volume of shipments of this product weakened by 17.0 percent compared to same period last year. Likewise, export receipts from Petroleum Products, registered at $12.70 million and with a 0.4 percent share of the total export earnings, dropped by 23.4 percent compared to same month a year ago.
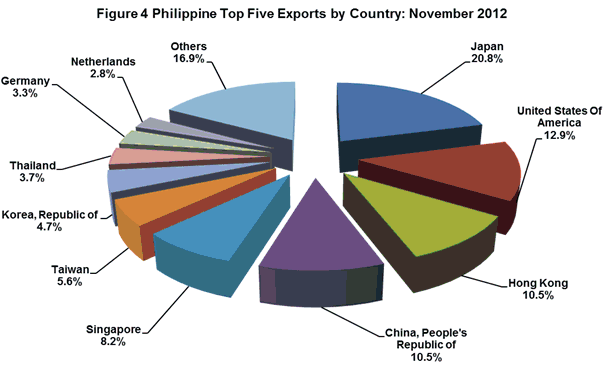
EXPORTS TO JAPAN ACCOUNT FOR 20.8 PERCENT
Japan including Okinawa, getting 20.8 percent share of the total exports for November 2012, emerged as the country’s top destination of exports with revenue amounting to $740.21 million. It was higher by 2.5 percent compared with $722.30 million recorded a year ago. The export items to Japan consist mainly of components/devices (semiconductors) and woodcraft products.
United States of America (USA) including Alaska and Hawaii with 12.9 percent share to total exports followed as the second top market of the country for November 2012 with export earnings worth $458.37 million. This represented a decrease of 8.6 percent from $501.53 million reported a year earlier. Electronic products particularly components/devices (semiconductors) and petroleum products are the goods mostly exported to USA.
Hong Kong, accounting for 10.5 percent share to total exports, came in third with shipments amounting to $373.81 million. Compared to the same month a year ago, however, its value expanded by 58.2 percent from $236.24 million. Products exported to Hong Kong comprised mostly of electronic products.
People’s Republic of China, also with 10.5 percent share of the total exports, ranked fourth in November 2012 with $371.66 million. This value was lower by 19.6 percent from last year’s level of $462.35 million.
Fifth in rank and representing 8.2 percent share to total exports was Singapore with export earnings worth $291.00 million which recorded a growth of 56.9 percent from $185.42 million posted in November 2011.
Other top ten markets for November 2012 were Taiwan, $199.36 million; Republic of Korea, $167.56 million; Thailand, $132.75 million; Germany, $118.02 million; and Netherlands, $98.30 million.
Total export receipts from the country’s top ten markets for the month of November 2012 amounted to $2.951 billion or 83.1 percent of the total.
EXPORTS TO EAST
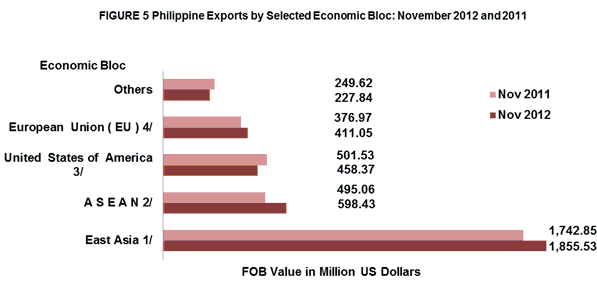
The merchandise exports of the Philippines to East Asia (China, Hong Kong, Japan, Macau, Mongolia, North Korea, South Korea and Taiwan) in November 2012 accounted for 52.3 percent share of total exports, amounting to $1.856 billion or an increase of 6.5 percent from its November 2011 figure of $1.743 billion.
Exports to ASEAN member-countries, accounting for 16.9 percent share to total merchandise exports in November 2012 reached $598.43 million and grew by 20.9 percent from $495.06 million recorded in November 2011.
Merchandise exports to European Union (EU), sharing 11.6 percent to total merchandise exports in November 2012 was valued at $411.05 million. It rose by 9.0 percent from $376.97 million posted in November 2011.
Notes:
1/ - includes China, Hong Kong, Japan, Macau, Mongolia, N, Korea, S. Korea, Taiwan
2/ - includes Brunei Darussalam, Cambodia, Indonesia, Laos, Malaysia, Myanmar, Singapore, Thailand, Vietnam
3/ - includes Alaska and Hawaii
4/ - includes Austria, Belgium, Bulgaria, Cyprus, Czech Republic, Denmark, Estonia, Finland, France, Germany, Greece,
Hungary, Ireland, Italy, Latvia, Lithuania, Luxembourg, Malta, Netherlands, Poland, Portugal, Romania, Slovakia,
Slovenia, Spain, Sweden and UK Great Britain
Technical Note:
Starting with the February 2007 Press Release, analysis and tables are based on the 2004 Philippine Standard Commodity Classification (PSCC) groupings. This is in compliance with NSCB Resolution No. 03, Series of 2005 entitled “Approving and Adopting the 2004 Philippine Standard Commodity Classification” by all concerned government agencies and instrumentalities.
CARMELITA N. ERICTA
Administrator