

EXPORTED GOODS FOR NOVEMBER 2013 UP BY 18.9 PERCENT
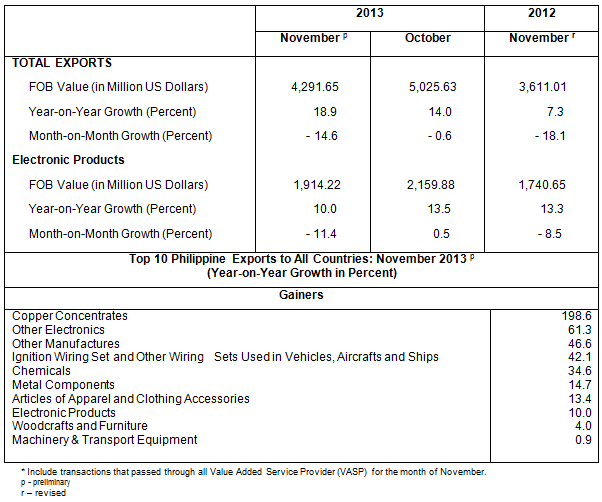
Export earnings in November 2013 amounted to $4.292 billion, an 18.9 percent growth from $3.611 billion recorded value in November of 2012. The positive growth was mainly brought by the increase of the top ten commodities for the month. On a monthly basis, it decreased by 14.6 percent from $5.026 billion posted in October 2013. Total merchandise exports for January to November 2013 registered a 2.6 percent increase to $49.376 billion in 2013 from $48.129 billion in same period of 2012.
ELECTRONIC PRODUCTS INCREASE BY 10.0 PERCENT
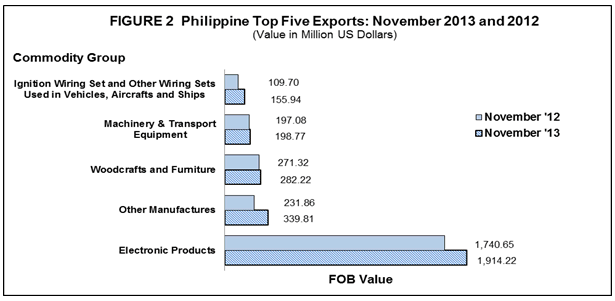
Electronic Products remained as the country’s top export with total receipts of $1.914 billion, accounting for 44.6 percent of the total exports revenue in November 2013. It increased by 10.0 percent from $1.741 billion registered in November 2012. However, on a month-on-month basis, Electronic Products decelerated by 11.4 percent from $2.160 billion posted in October 2013. Components/Devices (Semiconductors), which comprised 29.1 percent of the total exports, shared the biggest among the major groups of electronic products with export earnings worth $1.247 billion but declined by 11.0 percent from $1.402 billion recorded in November 2012.
Other Manufactures was the second top export earner in November 2013 with export revenue of $339.81 million, increasing by 46.6 percent from $231.86 million in November 2012.
Woodcrafts and Furniture recorded as the country’s third top export with revenue valued at $282.22 million or 6.6 percent share to total exports. It increased by 4.0 percent from $271.32 million in same period a year ago.
Machinery and Transport Equipment ranked fourth, with earnings amounting to $198.77 million in November 2013, contributing 4.6 percent share to the total export receipts. This recorded a 0.9 percent increase from the previous year level of $197.08 million.
Ignition Wiring Set and Other Wiring Sets Used in Vehicles, Aircrafts and Ships, with 3.6 percent share to the total export receipts, ranked fifth with value posted at $155.94 million. It increased by 42.1 percent from $109.70 million recorded value during the same month in 2012.
Rounding up the list of the top ten exports for the month of November 2013 were Metal Components with export earnings of $147.43 million, increasing by 14.7 percent; Articles of Apparel and Clothing Accessories with export receipts of $128.89 million, up by 13.4 percent; Other Electronics with proceeds billed at $127.72 million, increasing by 61.3 percent; Chemicals with export receipts of $123.64 million, rising by 34.6 percent; and Copper Concentrates with total receipts of $67.56 million, registering the highest positive year on year change of 198.6 percent.
Total receipts from the top ten exports reached $3.486 billion, or 81.2 percent of the total exports.
EXPORTS OF MANUFACT URED GOODS STAND AT $3.682 BILLION
Outward shipments of Manufactured Goods were valued at $3.682 billion, accounting for 85.8 percent of the total export receipts in November 2013. It increased by 16.9 percent from $3.150 billion recorded in November 2012. However, on a monthly basis, it decreased by 11.9 percent from $4.178 billion recorded in October 2013.
Receipts from Total Agro-Based Products, with a share of 6.2 percent in November 2013, amounted to $265.37 million. It increased by 38.1 percent from $192.17 million in November 2012.
Mineral Products recording a 4.4 percent share, increased by 3.0 percent to $187.87 million in November 2013 from $182.46 million in November 2012.
Merchandise exported from Special Transactions, comprising 2.5 percent share of the total exports revenue in November 2013, rose 54.0 percent to $107.59 million from $69.85 million in same month a year ago. Similarly, on a month-on-month basis, it increased by 24.2 percent from $86.61 million in October 2013.
Income from Petroleum Products, accounting for 1.0 percent share of the total exports revenue, increased by 250.1 percent to $44.45 million from $12.70 million reported value in same period a year ago.
Furthermore, Forest Products with 0.1 percent share, increased by 33.7 percent to $4.66 million in November 2013 from $3.49 million in same month in 2012.

JAPAN ACCOUNTS FOR 23.6 PERCENT TO TOTAL EXPORTS
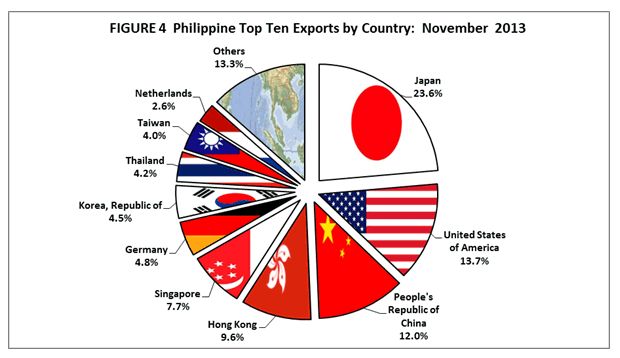
Japan including Okinawa remained as the country’s top destination of exports with revenue amounting to $1.012 billion, comprising 23.6 percent share to total exports for November 2013. It increased by 37.1 percent from $738.65 million recorded value in same month a year ago.
United States of America (USA) including Alaska and Hawaii with 13.7 percent share to total exports, ranked second with shipments valued at $589.33 million. It rose 22.7 percent from $480.39 million a year ago.
People’s Republic of China ranked third, comprising 12.0 percent share to total exports, with export receipts valued at $516.04 million in November 2013. This recorded an increase of 38.2 percent from $373.28 million in same month last year.
Hong Kong placed fourth, representing a 9.6 percent share to total exports, with export earnings worth $410.47 million. It increased by 9.8 percent from $373.81 million posted in November 2012.
Singapore ranked fifth in November 2013 with $329.58 million or 7.7 percent share of the total exports. It accelerated by 12.1 percent from $294.00 million year ago level.
Other top ten market destinations for November 2013 were: Germany, $206.17 million; Republic of Korea, $194.65 million; Thailand, $178.48 million; Taiwan, $172.07 million; and Netherlands, $113.42 million.
Total export receipts from the country’s top ten markets destinations for the month of November 2013 was valued at $3.723 billion or 86.7 percent of the total.
EXPORTS TO EAST
The country’s merchandise exports to East Asia in November 2013 accounted for 53.8 percent share to total exports, amounting to $2.309 billion or an increase of 23.1 percent from its November 2012 figure of $1.876 billion.
Commodities exported to ASEAN comprised 15.8 percent of the total exports in November 2013 and was valued at $676.32 million. This registered an increase of 12.1 percent from $603.27 million posted in same month a year ago.
Exports to European Union member-countries, with 11.1 percent share to total merchandise exports, amounted to $477.24 million, a 13.4 percent increase from $420.77 million recorded in November 2012.


Technical Note:
Starting with the February 2007 Press Release, analysis and tables are based on the 2004 Philippine Standard Commodity Classification (PSCC) groupings. This is in compliance with NSCB Resolution No. 03, Series of 2005 entitled “Approving and Adopting the 2004 Philippine Standard Commodity Classification” by all concerned government agencies and instrumentalities.
CARMELITA N. ERICTA
Administrator
| Attachment | Size |
|---|---|
|
|
410.95 KB |
|
|
341.54 KB |
|
|
429.23 KB |
|
|
343.01 KB |
|
|
299.67 KB |
|
|
285.71 KB |