
|
|||||||||||||||||||||||||||||||||||||||||||||||
|
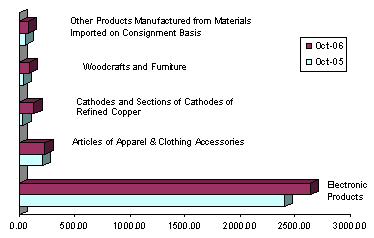
Top 10 Philippine Exports for All Countries: October 2006 p |
|||
|
Gainers |
Losers |
||
|
Cathodes and Sections of Cathodes of Refined Copper |
322.2 |
Petroleum Products |
-25.6 |
|
Woodcrafts and Furniture |
157.9 |
Metal Components |
-3.4 |
|
Other Products Manufactured from Materials Imported on Consignment Basis |
35.5 |
Bananas |
-0.4 |
|
Ignition Wiring Set and Other Wiring Sets Used in Vehicles, Aircrafts and Ships |
20.8 |
Coconut Oil |
-0.3 |
|
Articles of Apparel and Clothing Accessories |
11.4 |
|
|
|
Electronic Products |
9.9 |
|
|
* Includes transactions that passed through Automated Export Documentation System (AEDS).
p - preliminary
r - revised
MERCHANDISE EXPORTS GREW BY 15.5 PERCENT
Export earnings in October 2006 recorded an increment of 15.5 percent to $4.197 billion from $3.635 billion during the same month of the previous year. The export revenue for this month continued to record a double-digit increment with the highest noted in March of the current year.
Receipts from merchandise exports during January to October rose to 16.4 percent to $39.325 billion from $33.796 billion during the same period a year earlier.
ELECTRONIC PRODUCTS UP BY 9.9 PERCENT
Electronic Products, accounting for 62.9 percent of the aggregate export revenue in October, recorded an increase of 9.9 percent to $2.639 billion from $2.402 billion a year ago.
Among the major groups of electronic products, Components/Devices (Semiconductors) still got the major share of 46.8 percent to total exports, posting a growth of 10.9 percent to $1.962 billion from $1.769 billion during the same month in 2005. Except for Consumer Electronics, all other groups of electronic products showed increases, which include Electronic Data Processing at 6.7 percent with a share of 12.3 percent; Automotive Electronics at 3.6 percent with a share of 0.9 percent; Office Equipment at 23.6 percent with a share of 0.6 percent; Telecommunication at 19.9 percent with a share of 0.6 percent; Communication/Radar at 18.2 percent with a share of 0.6 percent. Interestingly, Control and Instrumentation, and Medical/Industrial Instrumentation commodity groups posted the highest growth, although it has a meager share to total exports of only 0.1 percent and 0.03 percent, respectively.
Articles of Apparel and Clothing Accessories remained as the country's second top earner with a combined share of 5.5 percent and an aggregate receipt of $231.39 million or 11.4 percent higher than $207.81 million a year ago. This is brought about by the huge demand for men's, women's, children's and infants' wear; as well as cotton and not knitted/crocheted women's/girls' trousers and breeches; and cotton and knitted/crocheted jerseys, pullovers, cardigans, waistcoats and similar articles.
Cathodes and Sections of Cathodes of Refined Copper, ranked third with total revenue of $130.30 million reflecting a 322.2 percent climb from $30.86 million during the same period of 2005. Except for January and March, this commodity group continued to sustain its triple-digit growth due to increasing demand for this commodity.
Woodcrafts and Furniture, ranked fourth with sales amounting to $87.32 million or an acceleration of 157.9 percent from $33.86 million due to the increase in demand for other builders' joinery and carpentry of wood and other wooden furniture.
Other Products Manufactured from Materials Imported on Consignment Basis, ranked fifth with export receipts of $78.63 million or a year-on-year growth of 35.5 percent from $58.02 million.
Rounding up the list of the top exports for the month of October 2006 are Ignition Wiring Set and Other Wiring Sets Used in Vehicles, Aircrafts and Ships (consists only of electrical wiring harness for motor vehicles), $78.36 million or an annual growth of 20.8 percent; Petroleum Products, with revenue recorded at $59.96 million or a decrease of 25.6 percent; Coconut Oil with an export valued at $47.26 million posting a decline of 0.3 percent; Metal Components with proceeds billed at $40.35 million or a decline of 3.4 percent; and Bananas(Fresh) with export revenue of US$31.78 million or 0.4 percent decrease from the same period in 2005.
Total receipts from the top ten exports reached $3.424 billion, or 81.6 percent of the total exports.
Fig. 1 Philippine Top Exports: October 2006 and 2005
(F.O.B. Value in Million US Dollars)
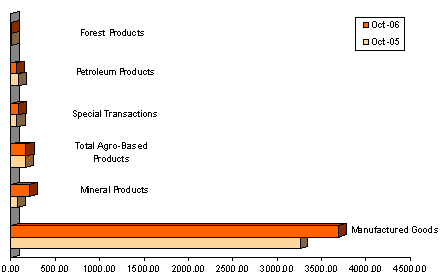
EXPORTS OF MANUFACTURED GOODS INCREASE BY 13.4 PERCENT
Accounting for 87.9 percent of the total receipts, export of Manufactured Goods was $3.691 billion or a 13.4 percent growth from $3.255 billion during the same period of 2005.
Earnings from Mineral Products reached $202.98 million or 4.8 percent of the total export revenue. Compared to last year, aggregate receipt for this commodity group gained by as much as 182.2 percent from $71.92 million due to the increase in the export receipts of all the mineral products except for iron ore agglomerates. Moreover, cumulative exports revenue for January to October recorded a 133.1 percent growth to US$1,616.552 billion from US$693.602 billion.
Income from All Agro-Based Products rose by 2.5 percent to $163.11million from $159.19 million. Receipts from exports of the Special Transaction likewise increase by 17.3 percent to US$78.21 million from US$66.68 million.
Petroleum Products, on the other hand, went down by 25.6 percent to $59.96 million from $80.57 million. However, cumulative revenue of this commodity group for January to October remained to register a positive growth of 69.9 percent to US$767.705 from US$451.829 billion. Meanwhile, exports revenue of Forest Products' inched-up by 35.9 percent to $2.18 million from1.60 million recorded in 2005.
Fig. 2 Philippine Exports by Commodity Group: October 2006 and 2005
(F.O.B. Value in Million US Dollars)
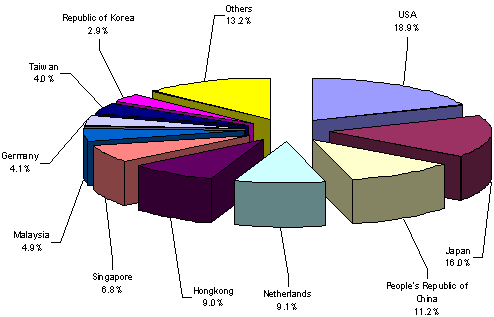
EXPORTS TO UNITED STATES ACCOUNT FOR 18.9 PERCENT
United States remained to be the major market of the country with exports receipts of $793.46 million, accounting for 18.9 percent of the country's aggregate income for the month. Receipts grew by 14.5 percent from last year's reported figure of $692.73 million.
Japan followed with earnings of $669.71 million or a 16.0 percent share of the total exports for the month which resulted to a growth of 29.7 percent from $516.53 million recorded in 2005.
People's Republic of China emerged as the third biggest market for the month with shipments amounted to $468.78 million or 11.2 percent of the total, an increment of 60.8 percent from a year ago level of $291.51 million.
Netherlands, with a $383.30 million or 9.1 percent of the total revenue, reflected a 7.2 percent decline from $412.81 million during the same month a year ago.
Other top markets for October 2006 are Hong Kong, $378.93 million; Singapore, $284.87 million; Malaysia, $204.99 million; Germany, $171.55 million; Taiwan, $168.19 million; and Republic of Korea, $121.41 million.
Total export receipts from RP's top ten markets for the month of October amounted to $3.645 billion or 86.9 percent of the total.
Fig. 3 Philippine Top Exports by Country: October 2006
(F.O.B. Value in Million US Dollars)
Technical Notes:
1. Analysis and Tables 1 to 3 in this Press Release are based on data using the 1993 Philippine Standard Commodity Classification (PSCC) groupings (as amended in 1999).
2. Starting with the July 2006 series of Foreign Trade Statistics (FTS), additional tables (Tables 4 and 5) using the 2004 PSCC groupings are provided.
3.The adoption of the 2004 PSCC is in compliance with NSCB Resolution No. 03, Series of 2005 entitled "Approving and Adopting the 2004 Philippine Standard Commodity Classification" by all concerned government agencies and instrumentalities.
4. In view of the adoption of the new classification system, the NSO shall issue two sets of detailed tables: 7-digit following the 1993 PSCC (as amended in 1999) and 10-digit using the 2004 PSCC simultaneously, until the December 2006 FTS. However, beginning January 2007 FTS, only the 2004 PSCC groupings will be released by NSO.
5. Detailed tables at commodity levels are available upon request from the NSO-Industry and Trade Statistics Department, 10 days after the monthly press release.
|
(Sgd.) CARMELITA N. ERICTA |
Source: Foreign Trade Statistics Section
Industry and Trade Statistics Department
National Statistics Office
Manila, Philippines