
MERCHANDISE EXPORTS PERFORMANCE
FEBRUARY 2015
(Preliminary)
|
|
February
|
||
|---|---|---|---|
|
|
2015 p |
2014 r |
|
|
TOTAL EXPORTS FOB Value in Million US Dollars Year-on-Year Growth (Percent) Electronic Products FOB Value in Million US Dollars Year-on-Year Growth (Percent) |
4,512.67 -3.1
1,970.45 4.8 |
4,657.07 11.6
1,880.43 10.9 |
|
|
Top 10 Philippine Export to All Countries: February 2015 p
(Year-on-Year Growth in Percent)
|
|||
|---|---|---|---|
Gainers |
Losers |
||
|
Ignition Wiring Set and Other Wiring Sets Used in Vehicles, Aircrafts and Ships
|
39.2 |
Woodcrafts and Furniture
|
-40.7 |
|
Articles of Apparel and Clothing Accessories
|
24.0 |
Other Mineral Products
|
-36.6 |
|
Electronic Products
|
4.8 |
Metal Components
|
-35.4 |
|
Chemicals
|
2.9 |
Electronic Equipment and Parts
|
-24.8 |
|
|
Other Manufactures
|
-12.8 | |
|
Machinery and Transport Equipment
|
-3.6 | ||
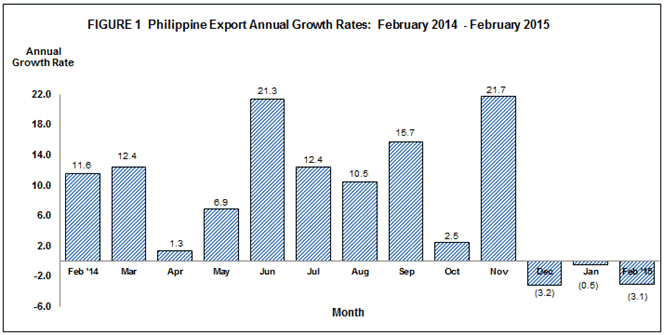
FEBRUARY 2015 OUTBOUND MERCHANDISE DECREASE BY 3.1 PERCENT
The Philippines’ export earnings totaled $4.513 billion in February 2015, a 3.1 percent decrement from $4.657 billion recorded value in February of 2014. The negative growth was mainly brought about by the decrease of six major commodities out of the top ten commodities for the month and these were: woodcrafts and furniture; other mineral products; metal components; electronic equipment and parts; other manufactures; and machinery and transport equipment (Table 1).
Furthermore, aggregate merchandise exports for January to February 2015 likewise registered a 1.8 percent decrease from $9.036 billion in 2014 to $8.869 billion in same period of 2015 (Table 1a).
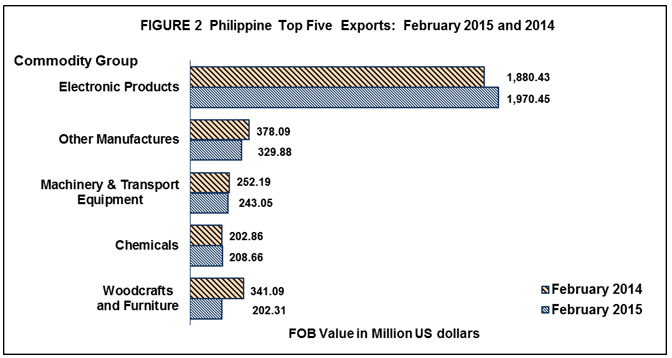
ELECTRONIC PRODUCTS UP BY 4.8 PERCENT
Electronic Products remained as the country’s top export with total receipts of $1.970 billion, accounting for 43.7 percent of the total exports revenue in February 2015. It increased by 4.8 percent from $1.880 billion registered in February 2014. By major groups of electronic products, Components/Devices (Semiconductors), comprised 29.5 percent of the total exports and shared the biggest with export earnings worth $1.333 billion and rose by 16.0 percent from $1.149 billion recorded in February 2014.
Other Manufactures was the second top export earner in February 2015 with export revenue of $329.88 million, decreased by 12.8 percent from $378.09 million in February 2014.
Machinery and Transport Equipment, with 5.4 percent share to the total export receipts, ranked third with value posted at $243.05 million. This recorded a decrease of 3.6 percent from February 2014 value of $252.19 million.
Chemicals ranked fourth, with sales amounting to $208.66 million in February 2015, contributing 4.6 percent share to the total export receipts. This registered a 2.9 percent increase from the previous year level of $202.86 million.
Woodcrafts and Furniture recorded as the country’s fifth top export with revenue valued at $202.31 million or 4.5 percent share to total exports. It declined by 40.7 percent from $341.09 million in same period a year ago.
Rounding up the list of the top ten exports for the month of February 2015 were Ignition Wiring Set and Other Wiring Sets Used in Vehicles, Aircrafts and Ships with export earnings of $183.29 million, increased by 39.2 percent; Articles of Apparel and Clothing Accessories with export receipts of $150.54 million, up by 24.0 percent; Metal Components with proceeds billed at $107.72 million, decreased by 35.4 percent; Other Mineral Products with export receipts of $97.53 million, fell by 36.6 percent; and Electronic Equipment and Parts with total receipts of $94.97 million, dropped by 24.8 percent compared to a year ago level.
Total receipts from the top ten exports reached $3.588 billion, or 79.5 percent of the total exports.
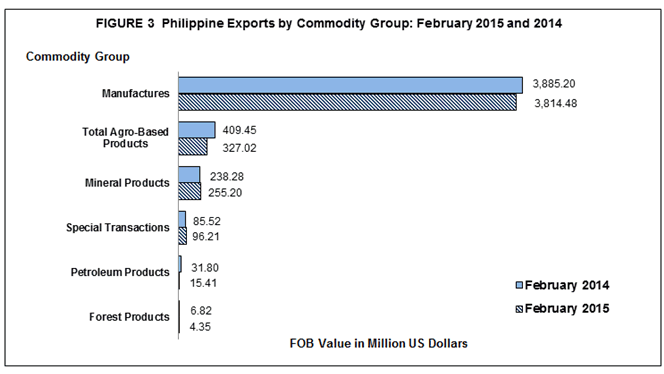
EXPORTS OF MANUFACTURED GOODS DOWN BY 1.8 PERCENT
Outward shipments of Manufactured Goods were valued at $3.814 billion, accounting for 84.5 percent of the total export receipts in February 2015. It decreased by 1.8 percent from $3.885 billion recorded in February 2014 (Table 2).
Export sales from Total Agro-Based Products, with a share of 7.2 percent in February 2015, amounted to $327.02 million. It contracted by 20.1 percent from $409.45 million in February 2014.
Mineral Products recorded a 5.7 percent share, increased by 7.1 percent to $255.20 million in February 2015 from $238.28 million in February 2014.
Merchandise exports from Special Transactions, comprising 2.1 percent share of the total exports revenue in February 2015, accelerated by 12.5 percent to $96.21 million from $85.52 million in same month a year ago.
Earnings from Petroleum Products, accounting for 0.3 percent share of the total exports revenue, decreased by 51.5 percent from $31.80 million to $15.41 million reported value in same period of 2015.
Moreover, Forest Products with 0.1 percent share, decreased by 36.2 percent from $6.82 million in February 2014 to $4.35 million in same month in 2015.
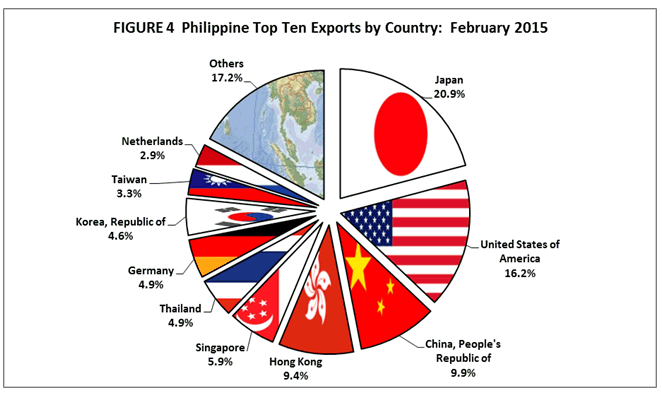
JAPAN ACCOUNTS FOR 20.9 PERCENT TO TOTAL EXPORTS
Japan including Okinawa remained as the country’s top destination of exports with revenue amounting to $942.29 million, comprising 20.9 percent share to total exports for February 2015. It decreased by 20.2 percent from $1.181 billion recorded value in same month a year ago.
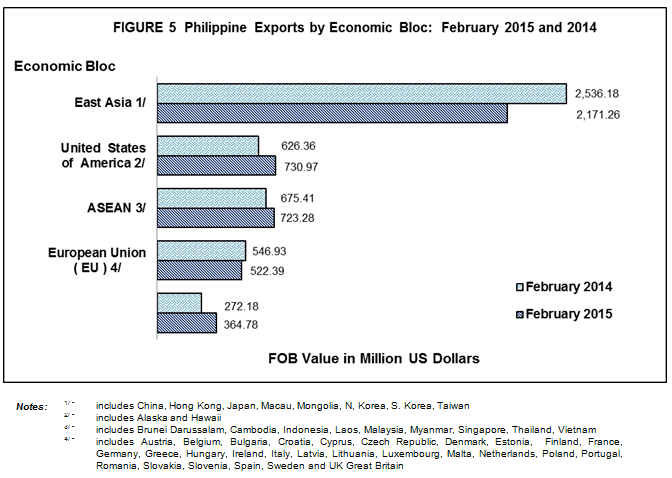
United States of America (USA) including Alaska and Hawaii ranked second, accounting 16.2 percent to total exports, with export receipts valued at $730.97 million in February 2015. This recorded an increase of 16.7 percent from $626.36 million in same month last year.
People’s Republic of China with 9.9 percent share to total exports, ranked third with shipments valued at $445.36 million. It dropped by 34.8 percent from $682.86 million a year ago.
Hong Kong ranked fourth in February 2015 with $422.23 million or 9.4 percent share of the total exports. It rose by 28.7 percent from $327.95 million year ago level.
Singapore placed fifth, representing a 5.9 percent share to total exports, with export earnings worth $266.52 million. It decreased by 14.3 percent from $311.06 million posted in February 2014.
Other top ten market destinations for February 2015 were: Thailand, $222.59 million; Germany, $219.21 million; Republic of Korea, $207.37 million; Taiwan, $147.10 million; and Netherlands, $131.60 million.
Total export receipts from the country’s top ten markets destinations for the month of February 2015 was valued at $3.735 billion or 82.8 percent of the total (Table 3).
EXPORTS TO EAST ASIA VALUED AT $2.171 BILLION
The merchandise exports to countries in East Asia in February 2015 accounted for 48.1 percent share to total exports, amounting to $2.171 billion. It reduced by 14.4 percent from $2.536 billion of February 2014 figure.
Merchandise exported to ASEAN member countries comprised 16.0 percent of the total exports in February 2015 and was valued at $723.28 million. This registered an increase of 7.1 percent from $675.41 million posted in same month a year ago.
Exports to European Union member countries, with 11.6 percent share to total merchandise exports, amounted to $522.39 million, a 4.5 percent decrease from $546.93 million recorded in February 2014 (Table 3a).
Technical Note:
1.) Starting with the March 2007 Press Release, analysis and tables are based on the 2004 Philippine Standard Commodity Classification (PSCC) groupings. This is in compliance with NSCB Resolution No. 03, Series of 2005 entitled “Approving and Adopting the 2004 Philippine Standard Commodity Classification” by all concerned government agencies and instrumentalities.
2.) Starting 2014 Export Revised FOB value, all transactions that pass through all Value Added Service Providers (VASPs) of Bureau of Customs (BOC) and Philippine Economic and Zone Authority (PEZA) were included. Physical export declaration and electronic data files were the basis of export statistics.
(Sgd.) LISA GRACE S. BERSALES, Ph. D.
National Statistician