
MERCHANDISE EXPORTS PERFORMANCE
NOVEMBER 2014
(Preliminary)
|
|
November
|
||
|---|---|---|---|
|
|
2014 p |
2013 r |
|
|
TOTAL EXPORTS FOB Value in Million US Dollars Year-on-Year Growth (Percent) Electronic Products FOB Value in Million US Dollars Year-on-Year Growth (Percent) |
5,178.40 19.7
2,546.39 27.0 |
4,324.99 19.8
2,005.36 15.2 |
|
|
Top 10 Philippine Export to All Countries: November 2014 p
(Year-on-Year Growth in Percent)
|
|||
|---|---|---|---|
Gainers |
Loser |
||
|
Coconut Oil
|
315.5 |
Other Manufactures
|
-27.2 |
|
Cathodes & Sections of Cathodes, of Refined Copper
|
138.3 | ||
|
Machinery & Transport Equipment
|
97.0 | ||
|
Chemicals
|
29.7 | ||
|
Woodcrafts and Furniture
|
27.5 | ||
|
Ignition Wiring Set and Other Wiring Sets Used in Vehicles, Aircrafts and Ships
|
27.3 | ||
|
Electronic Products
|
27.0 | ||
|
Articles of Apparel and Clothing Accessories
|
23.0 | ||
|
Metal Components
|
5.8 | ||
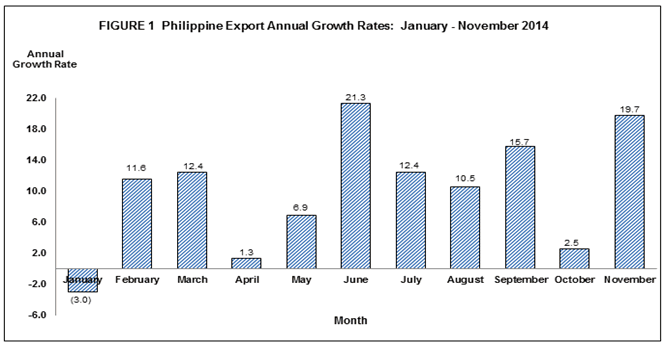
NOVEMBER 2014 OUTWARD GOODS INCREASE BY 19.7 PERCENT
The country’s export earnings totaled $5.178 billion in November 2014, a 19.7 percent growth from $4.325 billion recorded value in November of 2013. The positive growth was mainly brought about by the increase of nine major commodities out of the top ten commodities for the month and these were: coconut oil; cathodes and sections of cathodes, of refined copper; machinery & transport equipment; chemicals; woodcrafts and furniture; ignition wiring set and other wiring sets used in vehicles, aircrafts and ships; electronic products; articles of apparel and clothing accessories; and metal components (Table 1).
Furthermore, aggregate merchandise exports for January to November 2014 registered a 10.0 percent increase to $56.926 billion in 2014 from $51.738 billion in same period of 2013 (Table 1a).
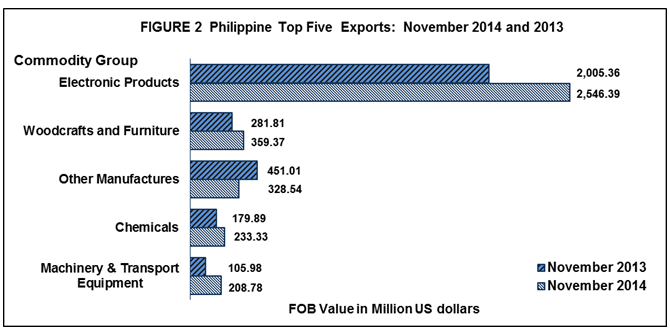
ELECTRONIC PRODUCTS GREW BY 27.0 PERCENT
Electronic Products remained as the country’s top export with total receipts of $2.546 billion, accounting for 49.2 percent of the total exports revenue in November 2014. It increased by 27.0 percent from $2.005 billion registered in November 2013. By major groups of electronic products, Components/Devices (Semiconductors), comprised 35.8 percent of the total exports and shared the biggest with export earnings worth $1.855 billion and rose by 39.3 percent from $1.331 billion recorded in November 2013.
Woodcrafts and Furniture was the second top export earner in November 2014 with export revenue of $359.37 million, increased by 27.5 percent from $281.81 million in November 2013.
Other Manufactures, with 6.3 percent share to the total export receipts, ranked third with value posted at $328.54 million. This recorded a decrease of 27.2 percent from November 2013 value of $451.01 million.
Chemicals ranked fourth, with sales amounting to $233.33 million in November 2014, contributing 4.5 percent share to the total export receipts. This registered a 29.7 percent increase from the previous year level of $179.89 million.
Machinery and Transport Equipment recorded as the country’s fifth top export with revenue valued at $208.78 million or 4.0 percent share to total exports. It increased by 97.0 percent from $105.98 million in same period a year ago.
Rounding up the list of the top ten exports for the month of November 2014 were Ignition Wiring Set and Other Wiring Sets Used in Vehicles, Aircrafts and Ships with export earnings of $194.66 million, increased by 27.3 percent; Coconut Oil with export receipts of $158.54 million, up by 315.5 percent and registered the highest year-on-year increase among the top ten exports during this period; Articles of Apparel and Clothing Accessories with proceeds billed at $132.14 million, increased by 23.0 percent; Metal Components with export receipts of $112.88 million, rose by 5.8 percent; and Cathodes and Sections of Cathodes, of Refined Copper with total receipts of $93.00 million, grew by 138.3 percent compared to a year ago level.
Total receipts from the top ten exports reached $4.368 billion, or 84.3 percent of the total exports.
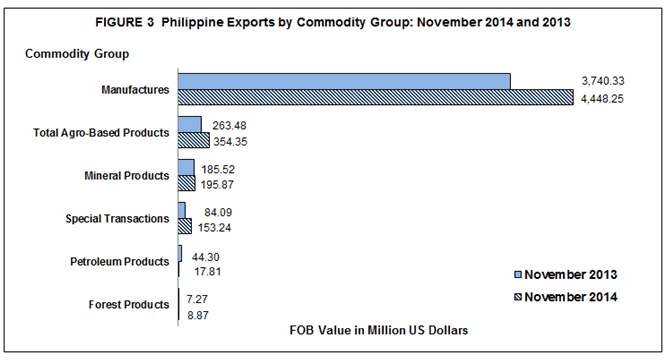
EXPORTS OF MANUFACTURED GOODS ACCELERATES BY 18.9 PERCENT
Outbound shipments of Manufactured Goods were valued at $4.448 billion, accounting for 85.9 percent of the total export receipts in November 2014. It increased by 18.9 percent from $3.740 billion recorded in November 2013 (Table 2).
Export sales from Total Agro-Based Products, with a share of 6.8 percent in November 2014, amounted to $354.35 million. It increased by 34.5 percent from $263.48 million in November 2013.
Mineral Products recorded a 3.8 percent share, increased by 5.6 percent to $195.88 million in November 2014 from $185.52 million in November 2013.
Merchandise exports from Special Transactions, comprising 3.0 percent share of the total exports revenue in November 2014, accelerated by 82.2 percent to $153.24 million from $84.09 million in same month a year ago.
Earnings from Petroleum Products, accounting for 0.3 percent share of the total exports revenue, decreased by 59.8 percent from $44.30 million to $17.81 million reported value in same period of 2014.
Moreover, Forest Products with 0.2 percent share, increased by 21.9 percent to $8.87 million in November 2014 from $7.27 million in same month in 2013.
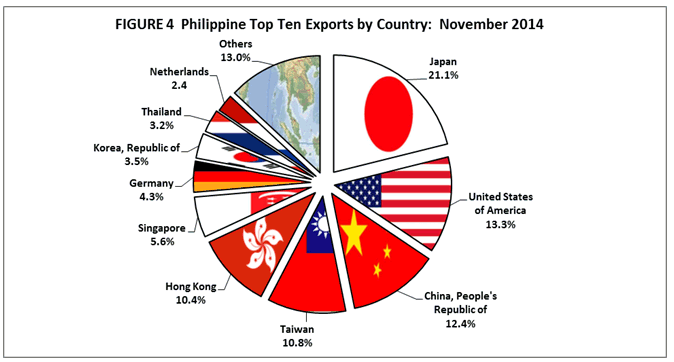
JAPAN ACCOUNTS FOR 21.1 PERCENT TO TOTAL EXPORTS
Japan including Okinawa remained as the country’s top destination of exports with revenue amounting to $1.093 billion, comprising 21.1 percent share to total exports for November 2014. It increased by 5.5 percent from $1.036 billion recorded value in same month a year ago.
United States of America (USA) including Alaska and Hawaii ranked second, accounting 13.3 percent to total exports, with export receipts valued at $689.43 million in November 2014. This recorded an increase of 16.5 percent from $591.94 million in same month last year.
People’s Republic of China with 12.4 percent share to total exports, ranked third with shipments valued at $644.03 million. It expanded by 25.1 percent from $514.99 million a year ago.
Taiwan ranked fourth in November 2014 with $559.31 million or 10.8 percent share of the total exports. It rose by 227.4 percent from $170.83 million year ago level.
Hong Kong placed fifth, representing a 10.4 percent share to total exports, with export earnings worth $538.34 million. It increased by 30.6 percent from $412.32 million posted in November 2013.
Other top ten market destinations for November 2014 were: Singapore, $289.78 million; Germany, $220.80 million; Republic of Korea, $178.90 million; Thailand, $163.40 million; and Netherlands, $125.40 million.
Total export receipts from the country’s top ten markets destinations for the month of November 2014 was valued at $4.503 billion or 87.0 percent of the total (Table 3).
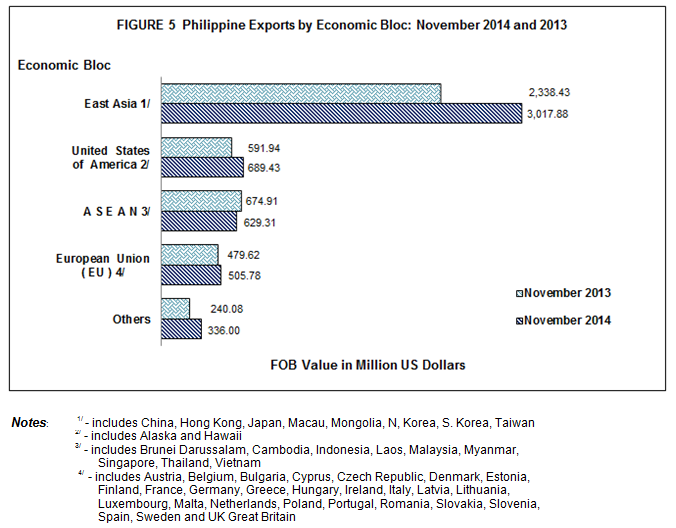
58.3 PERCENT OF EXPORTS WERE FROM EAST ASIA MEMBER COUNTRIES
The merchandise exports to countries in East Asia in November 2014 accounted for 58.3 percent share to total exports, amounting to $3.018 billion or an increase of 29.1 percent from $2.338 billion of November 2013 figure.
Merchandise exported to ASEAN member countries comprised 12.2 percent of the total exports in November 2014 and was valued at $629.31 million. This registered a decrease of 6.8 percent from $674.91 million posted in same month a year ago.
Exports to European Union member countries, with 9.8 percent share to total merchandise exports, amounted to $505.78 million, a 5.5 percent increment from $479.62 million recorded in November 2013 (Table 3a).
Technical Note:
1.) Starting with the March 2007 Press Release, analysis and tables are based on the 2004 Philippine Standard Commodity Classification (PSCC) groupings. This is in compliance with NSCB Resolution No. 03, Series of 2005 entitled “Approving and Adopting the 2004 Philippine Standard Commodity Classification” by all concerned government agencies and instrumentalities.
2.) Starting 2013 Export Revised FOB value, all transactions that pass through all Value Added Service Providers (VASPs) of Bureau of Customs (BOC) and Philippine Economic and Zone Authority (PEZA) were included. Physical export declaration and electronic data files were the basis of export statistics.
(Sgd.) LISA GRACE S. BERSALES, Ph. D.
National Statistician