
|
Table A Year-on-Year Growth Rates for Production Index, Net Sales Index
and Producer Price Index: August 2014 and August 2013
|
||
|---|---|---|
|
TOTAL MANUFACTURING |
AUGUST
2014
|
AUGUST
2013
|
|
YEAR-ON-YEAR GROWTH |
|
|
|
Production Index (2000=100) |
|
|
|
Value (VaPI) |
5.1 |
9.8 |
|
Volume (VoPI) |
7.5 |
17.5 |
|
Net Sales Index (2000=100) |
|
|
|
Value (VaNSI) |
3.3 |
21.5 |
|
Volume (VoNSI) |
5.6 |
30.1 |
|
Producer Price Index (2000=100) |
-2.2r |
-6.4 |
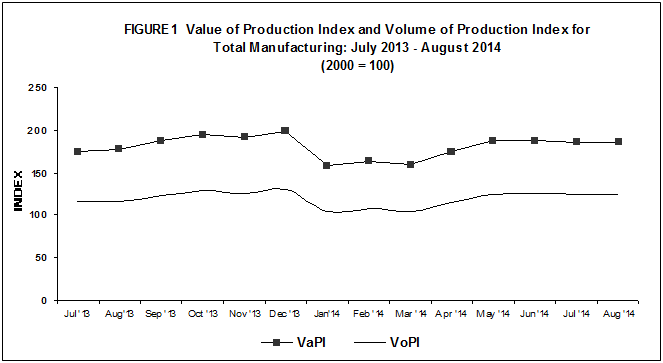
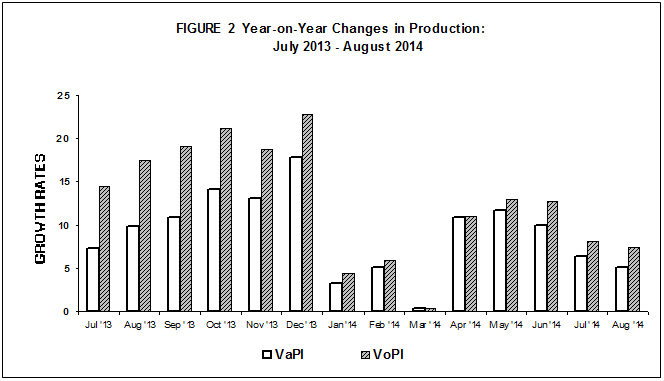
- Value of Production Index accelerates at a slower pace
Value of Production Index (VaPI) for manufacturing recorded a slower growth of 5.1 percent compared with the year-ago figure of 9.8 percent. This was mainly accounted for the reduction in value of production in the wood and wood products, chemical products, and food manufacturing sectors. While printing contributed significantly to the increase with 218.6 percent growth, followed by major sectors that registered two-digit growth in VaPI, namely: leather products (54.3%), beverages (32.7%), fabricated metal products (16.2%), machinery except electrical (14.0%), and transport equipment (11.4%). Refer to Tables 1-A and 1.
- Volume of Production likewise gains in August 2014
Volume of Production Index (VoPI) accelerated at a slower rate as it posted a year-on-year growth of 7.5 percent in August 2014. Nine of 13 major sectors exhibited two-digit growth in production output, with printing influencing the largest increment of 218.6 percent. The other eight major sectors that posted two-digit increases were the following: leather products (50.5%), beverages (31.6%), machinery except electrical (30.1%),%), fabricated metal products (23.5%), transport equipment (11.6%), basic metals (11.6%), petroleum products (11.4%), and furniture and fixtures (10.5%). Refer to Tables 1-B and 2.
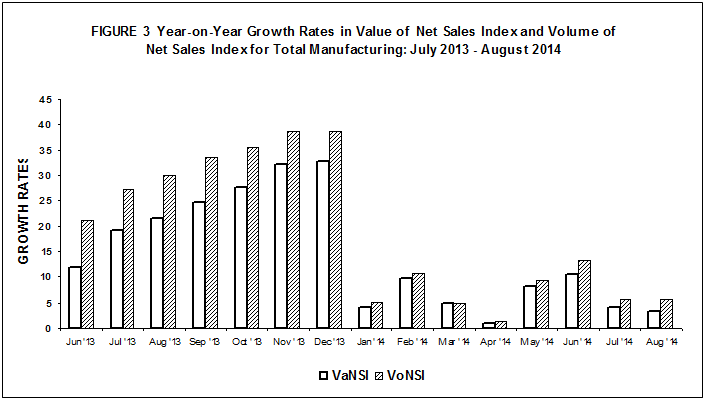
- Value of Net Sales Index sustains growth in August 2014
Value of Net Sales Index (VaNSI) recorded an increment of 3.3 percent in August 2014 compared with 21.5 percent registered in August 2013. This maybe explained by the two-digit decline in sales value of the wood and wood products industry. Whereas, thirteen major sectors reported increases in VaNSI led by printing (118.5%) and with two-digit increase in the following: textiles (42.9%), fabricated metal products (28.0%), electrical machinery (19.2%), basic metals (16.7%), leather products (14.7%), transport equipment (14.1%), petroleum products (13.7%), and rubber and plastic products (10.9%). Refer to Tables 2-A and 3.
- Volume of Net Sales Index also gains in August 2014
Volume of Net Sales Index (VoNSI), gained at a slower rate of 5.6 percent in August 2014 compared with 30.1 percent in August 2013. This was attributed to the increases in sales output reported by 13 major sectors, led by printing which exhibited a three-digit growth of 118.5 percent. Other major sectors that significantly contributed to the growth were: textiles (41.8%), fabricated metal products (36.0%), basic metals (24.9%), machinery except electrical (23.6%), electrical machinery (20.8%), furniture and fixtures (16.4%), petroleum products (16.1%), transport equipment (14.3%), and leather products (11.8%),. Refer to Tables 2-B and 4.
- Capacity Utilization in August 2014 is 83.5 percent
Average capacity utilization in August 2014 for total manufacturing stood at 83.5 percent. More than 50 percent or eleven of the 20 major industries operated at 80 percent and above capacity utilization rates. These are:
- basic metals (89.1%)
- petroleum products (88.9%)
- non-metallic mineral products (86.0%)
- machinery except electrical (84.6%)
- food manufacturing (84.4 %)
- electrical machinery (84.4%)
- chemical products (83.9%)
- paper and paper products (82.9%)
- rubber and plastic products (82.5%)
- printing (81.8%)
- wood and wood products (81.5%)
The proportion of establishments that operated at full capacity (90% to 100%) was 23.3 percent in August 2014. About 57.6 percent of the establishments operated at 70% to 89% capacity while 19.1 percent of the establishments operated below 70% capacity. Refer to Table 6 and B.
|
Table B Distribution of Key Manufacturing Establishments by Capacity Utilization for Total Manufacturing: August 2014 |
|
|---|---|
|
Capacity Utilization |
Percent Share |
|
Below 50% |
3.8 |
|
50% - 59% |
5.3 |
|
60% - 69% |
10.0 |
|
70% - 79% |
21.1 |
|
80% - 89% |
36.5 |
|
90% - 100% |
23.3 |
- Response Rate
The response rates for the August 2014 MISSI and PPS are 83.6 percent and 93.3 percent, respectively. Refer to Tables 7 and 8.
|
Table C Response Rates For Total Manufacturing
(In percent)
|
||
|---|---|---|
|
|
August 2014 |
July 2014
(Revised)
|
|
MISSI |
83.6 |
92.4r |
|
PPS |
93.3 |
94.4r |
Data of non-responding samples were estimated using short term relative of responding samples within the industry class. Revisions to the preliminary estimates are done upon receipt of actual reports of late respondents.
|
Gainers |
Year-on-Year Growth (%) |
|
|---|---|---|
| August 2014 |
July 2014
(revised)
|
|
|
Printing |
218.6 |
193.3 |
|
Beverages |
32.7 |
40.3 |
|
Machinery except electrical |
14.0 |
10.1 |
|
Petroleum products |
9.2 |
-6.6 |
|
Transport equipment |
11.4 |
-13.8 |
|
Electrical machinery |
2.0 |
12.8 |
|
Fabricated metal products |
16.2 |
18.9 |
|
Basic metals |
4.2 |
12.3 |
|
Non-metallic mineral products |
5.1 |
-23.9 |
|
Paper and paper products |
7.5 |
-0.5 |
|
Leather products |
54.3 |
51.5 |
|
Textiles |
5.1 |
-0.4 |
|
Losers |
Year-on-Year Growth (%) |
|
|---|---|---|
| August 2014 |
July 2014
(revised)
|
|
|
Footwear and wearing apparel |
-13.2 |
-12.4 |
|
Chemical products |
-4.9 |
3.1 |
|
Tobacco products |
-16.5 |
-9.3 |
|
Miscellaneous manufactures |
-14.6 |
-16.7 |
|
Wood and wood products |
-15.9 |
13.8 |
|
Rubber and plastic products |
-3.0 |
-1.4 |
|
Food manufacturing |
-0.3 |
6.2 |
|
Furniture and fixtures |
-3.3 |
-11.8 |
|
Gainers |
Year-on-Year Growth (%) |
|
|---|---|---|
|
August 2014 |
July 2014
(revised)
|
|
|
Machinery except electrical |
30.1 |
23.6 |
|
Printing |
218.6 |
193.3 |
|
Beverages |
31.6 |
39.2 |
|
Petroleum products |
11.4 |
-9.7 |
|
Electrical machinery |
3.4 |
12.5 |
|
Basic metals |
11.6 |
16.8 |
|
Transport equipment |
11.6 |
-13.0 |
|
Fabricated metal products |
23.5 |
27.9 |
|
Paper and paper products |
7.8 |
-0.7 |
|
Non-metallic mineral products |
4.6 |
-25.2 |
|
Leather products |
50.5 |
47.6 |
|
Furniture and fixtures |
10.5 |
7.8 |
|
Textiles |
4.3 |
-1.8 |
|
Losers |
Year-on-Year Growth (%) |
|
|---|---|---|
| August 2014 |
July 2014
(revised)
|
|
|
Food manufacturing |
-4.8 |
1.7 |
|
Tobacco products |
-25.1 |
-18.6 |
|
Footwear and wearing apparel |
-12.5 |
-12.9 |
|
Chemical products |
-3.6 |
3.5 |
|
Miscellaneous manufactures |
-10.2 |
-12.9 |
|
Rubber and plastic products |
-3.9 |
-2.8 |
|
Wood and wood products |
-17.4 |
11.2 |
|
Gainers |
Year-on-Year Growth (%) |
|
|---|---|---|
| August 2014 |
July 2014
(revised)
|
|
|
Electrical machinery |
19.2 |
12.3 |
|
Petroleum products |
13.7 |
9.0 |
|
Printing |
118.5 |
114.0 |
|
Machinery except electrical |
8.4 |
13.3 |
|
Textiles |
42.9 |
55.0 |
|
Basic metals |
16.7 |
0.8 |
|
Transport equipment |
14.1 |
-17.5 |
|
Fabricated metal products |
28.0 |
23.5 |
|
Paper and paper products |
8.6 |
2.2 |
|
Rubber and plastic products |
10.9 |
5.6 |
|
Non-metallic mineral products |
4.1 |
-3.0 |
|
Leather products |
14.7 |
18.5 |
|
Furniture and fixtures |
1.8 |
-12.7 |
|
Losers |
Year-on-Year Growth (%) |
|
|---|---|---|
| August 2014 |
July 2014
(revised)
|
|
|
Footwear and wearing apparel |
-36.4 |
-12.6 |
|
Chemical products |
-10.1 |
-3.3 |
|
Food manufacturing |
-3.0 |
5.0 |
|
Miscellaneous manufactures |
-11.8 |
-22.9 |
|
Beverages |
-4.8 |
6.2 |
|
Wood and wood products |
-17.2 |
14.6 |
|
Tobacco products |
-2.1 |
-2.2 |
|
Gainers |
Year-on-Year Growth (%) |
|
|---|---|---|
| August 2014 |
July 2014
(revised)
|
|
|
Electrical machinery |
20.8 |
12.0 |
|
Machinery except electrical |
23.6 |
27.2 |
|
Petroleum products |
16.1 |
5.4 |
|
Printing |
118.5 |
114.0 |
|
Basic metals |
24.9 |
4.9 |
|
Textiles |
41.8 |
52.8 |
|
Transport equipment |
14.3 |
-16.6 |
|
Fabricated metal products |
36.0 |
32.8 |
|
Paper and paper products |
8.9 |
2.0 |
|
Furniture and fixtures |
16.4 |
6.7 |
|
Rubber and plastic products |
9.9 |
4.1 |
|
Non-metallic mineral products |
3.6 |
-4.6 |
|
Leather products |
11.8 |
15.4 |
|
Losers |
Year-on-Year Growth (%) |
|
|---|---|---|
| August 2014 |
July 2014
(revised)
|
|
|
Food manufacturing |
-7.3 |
0.6 |
|
Footwear and wearing apparel |
-35.8 |
-13.1 |
|
Chemical products |
-8.9 |
-2.9 |
|
Beverages |
-5.6 |
5.3 |
|
Tobacco products |
-12.2 |
-12.3 |
|
Miscellaneous manufactures |
-7.3 |
-19.4 |
|
Wood and wood products |
-18.8 |
11.9 |