
Table A Year-on-Year Growth Rates for Production Index, Net Sales Index and Producer Price Index: December 2014 and 2013, and Average Annual Growth Rate 2014 and 2013
TOTAL MANUFACTURING |
DECEMBER
| AVERAGE ANNUAL GROWTH RATE | ||
YEAR-ON-YEAR GROWTH | 2014 | 2013 | 2014 | 2013 |
| Production Index (2000=100) |
|
| ||
| Value (VaPI) | 4.2 | 17.8 | 6.3 | 5.4 |
| Volume (VoPI) | 7.5 | 22.8 | 7.5 | 13.9 |
| Net Sales Index (2000=100) |
|
|
| |
| Value (VaNSI) | -3.2 | 32.9 | 3.3 | 16.1 |
| Volume (VoNSI) | -0.1 | 38.6 | 8.6 | 25.5 |
| Producer Price Index (2000=100) | -3.1r | -4.1 | -1.0 | -7.6 |
r - revised
- Value of Production Index accelerates at a slower pace
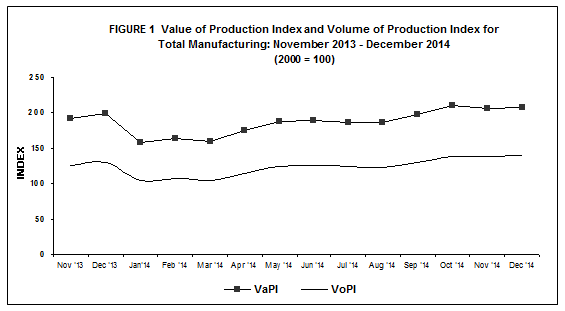
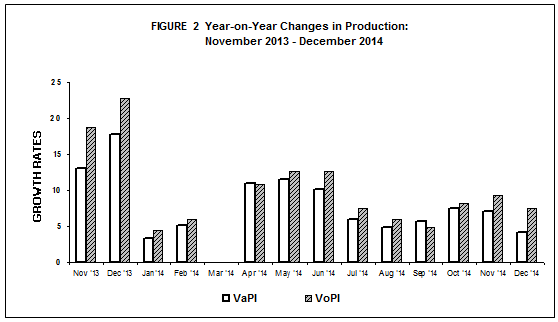
Value of Production Index (VaPI) for total manufacturing reflected a slower growth of 4.2 percent in December 2014 compared with 17.8 percent of the previous period, according to the preliminary results of the Monthly Integrated Survey of Selected Industries (MISSI). This was accounted for by the three-digit growth in production value for printing (269.7%) and two-digit growth in four other major sectors. These sectors were beverages (44.3%), wood and wood products (34.2%), basic metals (25.1%) and fabricated metal products (10.2%). Refer to Tables 1-A and 1.
Moreover, the 2014 average annual growth rate in the value of production was 6.3 percent, higher than the 5.4 percent recorder in 2013.
- Volume of Production likewise gains in December 2014
Volume of Production Index (VoPI) grew at a slower rate of 7.5 percent in December 2014. This was attributed to the expansion in production output observed in 12 major sectors, with consistent three-digit increase reported by printing at 269.7 percent growth. Other major sectors that recorded two-digit increases were the following: beverages (42.0%), basic metals (42.0%), wood and wood products (33.6%), fabricated metal products (15.7%). Refer to Tables 1-B and 2.
However, the 2014 average annual growth rate of 7.5 percent was lower than 13.9 percent in 2013.
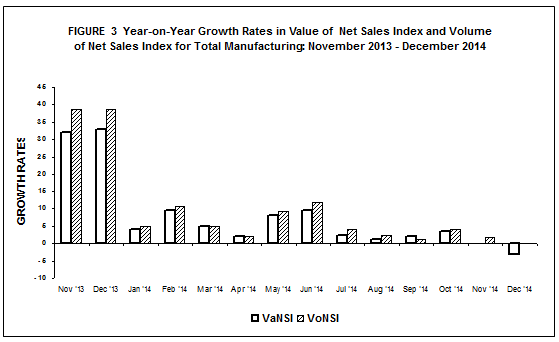
- Value of Net Sales Index slides further in December 2014
Value of Net Sales Index (VaNSI) continued to decelerate as it posted an annual decrease of 3.2 percent in December 2014 compared with two-digit growth of 32.9 percent during the same month last year. This was brought about by the poor production performance of 10 major sectors, with two-digit decreases reported by the following: footwear and wearing apparel (-29.0%), the heavily weighted sector of petroleum products (-23.9%), non-metallic mineral products (-12.6%), and miscellaneous manufactures (-10.0%). Refer to Tables 2-A and 3.
The 2014 average annual growth rate in value of net sales was only 3.3 percent in contrast with the two-digit value of 16.1 percent in 2013.
- Volume of Net Sales Index decelerates in December 2014
Volume of Net Sales Index (VoNSI) slightly declined by 0.1 percent in December 2014. Three major sectors posted significant decrement in volume of net sales. These were footwear and wearing apparel (-26.5%), non-metallic mineral products (-12.6%), and chemical products (-11.5%). Refer to Tables 2-B and 4.
The 2014 average annual growth rate in volume of net sales was 4.5 percent compared with 25.5 percent in 2013.
- Capacity Utilization in December 2014 is 83.6 percent
Average capacity utilization in December 2014 for total manufacturing was recorded at 83.6 percent. More than 50 percent or eleven of the 20 major industries operated at 80 percent and above capacity utilization rates. These are:
petroleum products (88.8%)
basic metals (88.5%)
non-metallic mineral products (86.2%)
electrical machinery (84.7%)
chemical products (84.7%)
food manufacturing (84.5 %)
machinery except electrical (84.5%)
paper and paper products (83.2%)
rubber and plastic products (82.5%)
printing (82.0%)
wood and wood products (81.7%)
The proportion of establishments that operated at full capacity (90% to 100%) was 24.5 percent in December 2014. About 57.3 percent of the establishments operated at 70% to 89% capacity while 18.2 percent of the establishments operated below 70% capacity. Refer to Table 6 and B.
Table B Distribution of Key Manufacturing Establishments by Capacity Utilization for Total Manufacturing: December 2014 | |
|---|---|
Capacity Utilization | Percent Share |
Below 50% | 3.6 |
50% - 59% | 4.9 |
60% - 69% | 9.7 |
70% - 79% | 22.0 |
80% - 89% | 35.3 |
90% - 100% | 24.5 |
- Response Rate
The response rates for the December 2014 MISSI and PPS are 84.5 percent and 86.9 percent, respectively. Refer to Tables 7 and 8.
Table C Response Rates For Total Manufacturing (In percent) | ||
|---|---|---|
| December 2014 | November 2014 (Revised) |
MISSI | 84.5 | 92.1r |
PPS | 86.9 | 96.4r |
r -revised
Data of non-responding samples were estimated using short term relative of responding samples within the industry class. Revisions to the preliminary estimates are done upon receipt of actual reports of late respondents.
TABLE 1-A Value of Production Index, November 2014– December 2014
(2000 =100)
Gainers | Year-on-Year Growth (%) | |
|---|---|---|
| December 2014 | November 2014 (revised) | |
| Printing | 269.7 | 281.1 |
| Beverages | 44.3 | 61.5 |
| Basic metals | 25.1 | 13.1 |
| Chemical products | 6.8 | 4.6 |
| Food manufacturing | 2.7 | 1.5 |
| Wood and wood products | 34.2 | 34.1 |
| Fabricated metal products | 10.2 | 51.1 |
| Non-metallic mineral products | 1.2 | 13.8 |
| Transport equipment | 0.5 | 5.1 |
| Miscellaneous manufactures | 0.8 | -6.8 |
Losers | Year-on-Year Growth (%) | |
|---|---|---|
| December 2014 | November 2014 (revised) | |
| Petroleum products | -21.9 | -12.4 |
| Footwear and wearing apparel | -27.9 | -30.2 |
| Tobacco products | -26.7 | -25.6 |
| Machinery except electrical | -4.3 | -2.0 |
| Electrical machinery | -1.1 | -3.9 |
| Rubber and plastic products | -6.5 | -8.9 |
| Furniture and fixtures | -19.8 | -6.3 |
| Paper and paper products | -2.7 | 11.5 |
| Textiles | -1.5 | 13.0 |
| Leather products | -9.0 | 9.5 |
Notes:
TABLE 1-B Volume of Production Index, November 2014– December 2014
(2000 = 100)
Gainers | Year-on-Year Growth (%) | |
|---|---|---|
December 2014 | November 2014 (revised) | |
| Printing | 269.7 | 281.1 |
| Beverages | 42.0 | 58.9 |
| Basic metals | 42.0 | 25.6 |
| Petroleum products | 7.1 | 3.8 |
| Chemical products | 5.1 | 2.7 |
| Machinery except electrical | 2.7 | 3.4 |
| Fabricated metal products | 15.7 | 59.2 |
| Wood and wood products | 33.6 | 32.7 |
| Miscellaneous manufactures | 8.5 | -0.5 |
| Non-metallic mineral products | 1.2 | 12.8 |
| Transport equipment | 0.3 | 5.6 |
| Electrical machinery | 1/ | -4.3 |
Losers | Year-on-Year Growth (%) | |
|---|---|---|
| December 2014 | November 2014 (revised) | |
| Footwear and wearing apparel | -25.4 | -28.1 |
| Tobacco products | -34.2 | -33.2 |
| Rubber and plastic products | -8.4 | -10.8 |
| Furniture and fixtures | -10.6 | 7.1 |
| Paper and paper products | -3.9 | 9.9 |
| Textiles | -2.5 | 11.8 |
| Food manufacturing | -0.2 | -1.8 |
| Leather products | -11.2 | 6.7 |
Notes:
TABLE 2-A Value of Net Sales Index, November 2014– December 2014
(2000 =100)
Gainers | Year-on-Year Growth (%) | |
|---|---|---|
| December 2014 | November 2014 (revised) | |
| Printing | 355.4 | 250.3 |
| Beverages | 32.8 | 12.1 |
| Basic metals | 31.7 | 12.1 |
| Textiles | 23.8 | 29.8 |
| Tobacco products | 15.0 | -10.0 |
| Fabricated metal products | 14.0 | 25.3 |
| Paper and paper products | 9.8 | 13.4 |
| Rubber and plastic products | 9.9 | 3.2 |
| Leather products | 19.0 | 21.5 |
| Wood and wood products | 0.1 | 36.2 |
Losers | Year-on-Year Growth (%) | |
|---|---|---|
| December 2014 | November 2014 (revised) | |
| Petroleum products | -23.9 | -10.4 |
| Chemical products | -10.0 | -7.9 |
| Footwear and wearing apparel | -29.0 | -27.5 |
| Non-metallic mineral products | -12.6 | 10.8 |
| Machinery except electrical | -3.3 | 5.5 |
| Food manufacturing | -0.9 | 1.1 |
| Electrical machinery | -0.8 | -3.2 |
| Transport equipment | -2.9 | 10.0 |
| Miscellaneous manufactures | -1.0 | -6.8 |
| Furniture and fixtures | -0.9 | -4.0 |
Notes:
TABLE 2-B Volume of Net Sales Index, November 2014– December 2014
(2000 = 100)
Gainers | Year-on-Year Growth (%) | ||
|---|---|---|---|
| December 2014 | November 2014 (revised) | ||
| Printing | 355.4 | 250.3 | |
| Basic metals | 49.5 | 24.5 | |
| Beverages | 30.7 | 10.3 | |
| Petroleum products | 4.4 | 6.2 | |
| Textiles | 22.5 | 28.4 | |
| Machinery except electrical | 3.9 | 11.3 | |
| Fabricated metal products | 19.7 | 32.0 | |
| Paper and paper products | 8.4 | 11.8 | |
| Miscellaneous manufactures | 6.5 | -0.5 | |
| Rubber and plastic products | 7.6 | 1.0 | |
| Furniture and fixtures | 10.4 | 9.7 | |
| Tobacco products | 3.2 | -19.2 | |
| Electrical machinery | 0.3 | -3.6 | |
| Leather products | 16.1 | 18.3 | |
Losers | Year-on-Year Growth (%) | ||
|---|---|---|---|
| December 2014 | November 2014 (revised) | ||
| Chemical products | -11.5 | -9.6 | |
| Footwear and wearing apparel | -26.5 | -25.4 | |
| Food manufacturing | -3.8 | -2.3 | |
| Non-metallic mineral products | -12.6 | 9.9 | |
| Transport equipment | -3.1 | 10.5 | |
| Wood and wood products | -0.3 | 34.8 | |
Notes: