
|
Table A Year-on-Year Growth Rates for Production Index, Net Sales Index
and Producer Price Index: July 2016 and July 2015
|
||
|---|---|---|
|
TOTAL MANUFACTURING |
JULY
2016
|
JULY
2015
|
|
Production Index (2000=100) |
|
|
|
Value (VaPI) |
5.6 |
-6.6 |
|
Volume (VoPI) |
10.1 |
0.1 |
|
Net Sales Index (2000=100) |
|
|
|
Value (VaNSI) |
1/ |
-4.2 |
|
Volume (VoNSI) |
4.3 |
2.8 |
|
Producer Price Index (2000=100) |
-4.1r |
-6.7 |
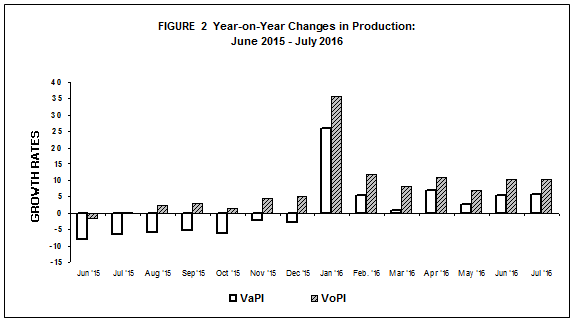
- Value of Production Index bounces in July 2016
Value of Production Index (VaPI) leaped as it posted an annual increment of 5.6 percent in July 2016 from a negative 6.6 percent during the same month of 2015, according to the preliminary results of the Monthly Integrated Survey of Selected Industries (MISSI). This was attributed to the increases in VaPI exhibited by nine major sectors, outpacing the decrements reported by 11 major sectors. Seven of the nine major sectors largely contributed to the increase in VaPI, namely: basic metals (56.9%), transport equipment (33.7%), rubber and plastic products (27.1%), tobacco products (19.8%), wood and wood products (18.5%), beverages (15.8%) and food manufacturing (15.7%). Refer to Tables 1-A and 1.
- Volume of Production posts two-digit increment
Volume of Production Index (VoPI) increased, posting a two-digit growth of 10.1 percent in July 2016. This was attributed to the significant expansion made by basic metals which surged by 64.1 percent on account of the non-ferrous metal industry. The industry grew 501.8 percent in July 2016.
Other major sectors with two-digit increases were observed in the following: transport equipment (35.8%), rubber and plastic products (29.7%), machinery except electrical (27.2%), wood and wood products (19.7%), tobacco products (19.6%), food manufacturing (14.1%) and beverages (10.9%). Refer to Tables 1-B and 2.

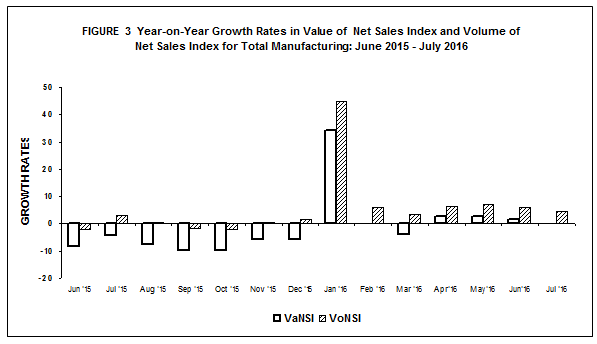
- Value of Net Sales Index slips
Value of Net Sales Index (VaNSI) reflected a minimal annual drop of less than one percent (0.02%) in July 2016, showing an improvement from the 4.2 percent decrease during the same period a year ago. Six major sectors mainly influenced the decline in VaNSI, posting two-digit decreases. These were fabricated metal products (-28.2%), printing (-23.0%), petroleum products (-19.7%), transport equipment (-19.1%), textiles (-17.9%) and furniture and fixtures (-12.1%). Refer to Tables 2-A and 3.
- Volume of Net Sales Index expands
Volume of Net Sales Index (VoNSI) gained as it posted a year-on-year growth of 4.3 percent in July 2016. Seven of the 11 major sectors that pulled-up the VoNSI showed significant increases, as follows: basic metals (44.4%), machinery except electrical (36.1%), wood and wood products (23.5%), leather products (17.5%), beverages (14.8%), furniture and fixtures (14.4%) and rubber and plastic products (13.0%). Refer to Tables 2-B and 4.
- Average Capacity Utilization Rate in July 2016 is 83.5 percent with basic metals posting the highest among industries
Average capacity utilization rate in July 2016 for total manufacturing was recorded at 83.5 percent. Fifty-five percent or 11 of the 20 major industries operated at 80 percent and above capacity utilization rates. These were:
- basic metals (88.5%)
- petroleum products (88.3%)
- non-metallic mineral products (86.5%)
- machinery except electrical (85.2%)
- food manufacturing (84.6%)
- electrical machinery (84.4%)
- chemical products (84.3%)
- paper and paper products (83.2%)
- rubber and plastic products (83.0%)
- wood and wood products (81.1%)
- printing (80.3%)
The proportion of establishments that operated at full capacity (90% to 100%) was 23.6 percent in July 2016. About 58.3 percent of the establishments operated at 70 percent to 89 percent capacity while 18.1 percent of the establishments operated below 70 percent capacity. Refer to Table B and 6.
|
Table B Distribution of Key Manufacturing Establishments by Capacity Utilization for Total Manufacturing: July 2016 |
|
|---|---|
|
Capacity Utilization |
Percent Share |
|
Below 50% |
3.3 |
|
50% - 59% |
5.1 |
|
60% - 69% |
9.7 |
|
70% - 79% |
23.5 |
|
80% - 89% |
34.8 |
|
90% - 100% |
23.6 |
- Industry Coverage
The 2016 MISSI utilizes the 2009 PSIC to classify major industries and sub-industries. Twenty major industries of the 2009 PSIC were formed to comprise the industry coverage of the 2016 MISSI. These are presented in the table below.
|
2009 PSIC CODE |
INDUSTRY DESCRIPTION |
|---|---|
|
C10 |
Food manufacturing * |
|
C11 |
Beverages |
|
C12 |
Tobacco products |
|
C13 |
Textiles* |
|
C14, C152 |
Footwear and wearing apparel |
|
C151 |
Leather products |
|
C16 |
Wood and wood products* |
|
C17 |
Paper and paper products |
|
C18 |
Printing |
|
C19 |
Petroleum products* |
|
C20,C21 |
Chemical products* |
|
C22 |
Rubber and plastic products* |
|
C23 |
Non-metallic mineral products* |
|
C24 |
Basic metals* |
|
C25,C3311 |
Fabricated metal products |
|
C262,C275,C28, C263,C268,C3312,C332 |
Machinery except electrical* |
|
C261,C264,C27, C29301,C3314,C332 |
Electrical machinery* |
|
C29 except C29301, C30,C3315 |
Transport equipment |
|
C31 |
Furniture and fixtures |
|
C265,C266,C267,C32, C3313,C3319 |
Miscellaneous manufactures |
|
Note: * - Major industries categorized into sub-industries |
|
- Response Rate
The response rates for the July 2016 MISSI and PPS are 79.7 and 84.3 percent, respectively. Refer to Tables 7 and 8.
|
Table C Response Rates for Total Manufacturing
(In percent)
|
||
|---|---|---|
|
|
July 2016 |
June 2016
(Revised)
|
|
MISSI |
79.7 |
90.3r |
|
PPS |
84.3r |
90.6r |
r - revised
Data of non-responding samples were estimated using short-term geometric mean of the relative values of responding samples within the industry class. Revisions to the preliminary estimates are done upon receipt of actual reports of late respondents.
FOR THE NATIONAL STATISTICIAN:
TABLE 1-A Value of Production Index, June 2016 and July 2016
(2000 =100)
|
Gainers |
Year-on-Year Growth (%) |
|
|---|---|---|
| July 2016 |
June 2016
(revised)
|
|
|
Food manufacturing |
15.7 |
4.0 |
|
Basic metals |
56.9 |
54.3 |
|
Transport equipment |
33.7 |
41.9 |
|
Rubber and plastic products |
27.1 |
28.6 |
|
Beverages |
15.8 |
26.8 |
|
Machinery except electrical |
6.2 |
35.5 |
|
Chemical products |
5.9 |
2.9 |
|
Tobacco products |
19.8 |
27.6 |
|
Wood and wood products |
18.5 |
11.0 |
|
Losers |
Year-on-Year Growth (%) |
|
|---|---|---|
| July 2016 |
June 2016
(revised)
|
|
|
Petroleum products |
-17.2 |
-14.8 |
|
Electrical machinery |
-6.4 |
-8.1 |
|
Fabricated metal products |
-34.4 |
-31.5 |
|
Footwear and wearing apparel |
-7.3 |
-9.0 |
|
Furniture and fixtures |
-28.2 |
-17.7 |
|
Leather products |
-87.2 |
-85.1 |
|
Textiles |
-10.7 |
-14.6 |
|
Miscellaneous manufactures |
-8.7 |
0.3 |
|
Paper and paper products |
-5.3 |
-2.2 |
|
Non-metallic mineral products |
-2.4 |
-1.4 |
|
Printing |
-2.8 |
12.1 |
TABLE 1-B Volume of Production Index, June 2016 and July 2016
(2000 = 100)
|
Gainers |
Year-on-Year Growth (%) |
|
|---|---|---|
| July 2016 |
June 2016
(revised)
|
|
|
Basic metals |
64.1 |
70.6 |
|
Machinery except electrical |
27.2 |
60.1 |
|
Food manufacturing |
14.1 |
2.6 |
|
Transport equipment |
35.8 |
40.2 |
|
Rubber and plastic products |
29.7 |
35.0 |
|
Chemical products |
6.9 |
3.8 |
|
Beverages |
10.9 |
21.4 |
|
Tobacco products |
19.6 |
27.1 |
|
Wood and wood products |
19.7 |
12.1 |
|
Losers |
Year-on-Year Growth (%) |
|
|---|---|---|
| July 2016 |
June 2016
(revised)
|
|
|
Electrical machinery |
-6.9 |
-8.3 |
|
Petroleum products |
-6.2 |
-1.9 |
| Fabricated metal products |
-34.6 |
-31.7 |
|
Miscellaneous manufactures |
-13.8 |
-5.6 |
|
Textiles |
-10.9 |
-15.2 |
|
Leather products |
-86.5 |
-84.3 |
|
Non-metallic mineral products |
-4.4 |
-4.0 |
|
Footwear and wearing apparel |
-2.9 |
-6.4 |
|
Paper and paper products |
-4.5 |
-2.8 |
|
Furniture and fixtures |
-6.6 |
7.4 |
|
Printing |
-2.1 |
12.8 |
TABLE 2-A Value of Net Sales Index, June 2016 and July 2016
(2000 =100)
|
Gainers |
Year-on-Year Growth (%) |
|
|---|---|---|
| July 2016 |
June 2016
(revised)
|
|
|
Basic metals |
38.0 |
34.0 |
|
Food manufacturing |
8.2 |
-0.6 |
|
Machinery except electrical |
13.8 |
24.7 |
|
Beverages |
19.9 |
24.4 |
|
Chemical products |
4.8 |
5.1 |
|
Non-metallic mineral products |
9.5 |
18.0 |
|
Rubber and plastic products |
10.7 |
13.2 |
|
Wood and wood products |
22.2 |
26.1 |
|
Paper and paper products |
3.4 |
18.7 |
|
Leather products |
11.2 |
9.4 |
|
Losers |
Year-on-Year Growth (%) |
|
|---|---|---|
| July 2016 |
June 2016
(revised)
|
|
|
Petroleum products |
-19.7 |
-12.2 |
|
Electrical machinery |
-8.8 |
-5.3 |
|
Transport equipment |
-19.1 |
-18.9 |
|
Fabricated metal products |
-28.2 |
-21.0 |
|
Textiles |
-17.9 |
-23.1 |
|
Footwear and wearing apparel |
-9.6 |
-10.9 |
|
Printing |
-23.0 |
-4.6 |
|
Miscellaneous manufactures |
-9.4 |
-0.8 |
|
Furniture and fixtures |
-12.1 |
-2.6 |
|
Tobacco products |
-1.8 |
0.1 |
TABLE 2-B Volume of Net Sales Index, June 2016 and July 2016
(2000 = 100)
|
Gainers |
Year-on-Year Growth (%) |
|
|---|---|---|
| July 2016 |
June 2016
(revised)
|
|
|
Machinery except electrical |
36.1 |
47.4 |
|
Basic metals |
44.4 |
48.2 |
|
Food manufacturing |
6.7 |
-1.9 |
|
Beverages |
14.8 |
19.1 |
|
Chemical products |
5.8 |
6.0 |
|
Non-metallic mineral products |
7.3 |
14.9 |
|
Rubber and plastic products |
13.0 |
18.9 |
|
Wood and wood products |
23.5 |
27.4 |
|
Furniture and fixtures |
14.4 |
27.2 |
|
Paper and paper products |
4.2 |
17.9 |
|
Leather products |
17.5 |
15.3 |
|
Losers |
Year-on-Year Growth (%) |
|
|---|---|---|
| July 2016 |
June 2016
(revised)
|
|
|
Electrical machinery |
-9.3 |
-5.5 |
|
Petroleum products |
-9.0 |
1.1 |
|
Transport equipment |
-17.8 |
-19.9 |
|
Fabricated metal products |
-28.5 |
-21.3 |
|
Textiles |
-18.0 |
-23.7 |
|
Miscellaneous manufactures |
-14.4 |
-6.6 |
|
Printing |
-22.5 |
-4.0 |
|
Footwear and wearing apparel |
-5.4 |
-8.3 |
|
Tobacco products |
-2.0 |
-0.3 |