
|
Table A Year-on-Year Growth Rates for Production Index, Net Sales Index and Producer Price Index: September 2018 and September 2017 |
||
|---|---|---|
|
TOTAL MANUFACTURING |
SEPTEMBER
2018
|
SEPTEMBER
2017
|
|
Production Index (2000=100) |
|
|
|
Value (VaPI) |
3.7 |
-6.2 |
|
Volume (VoPI) |
4.0 |
-5.7 |
|
Net Sales Index (2000=100) |
|
|
|
Value (VaNSI) |
5.6 |
-4.8 |
|
Volume (VoNSI) |
6.0 |
-4.3 |
|
Producer Price Index (2000=100) |
-0.3r |
-0.5 |
r - revised
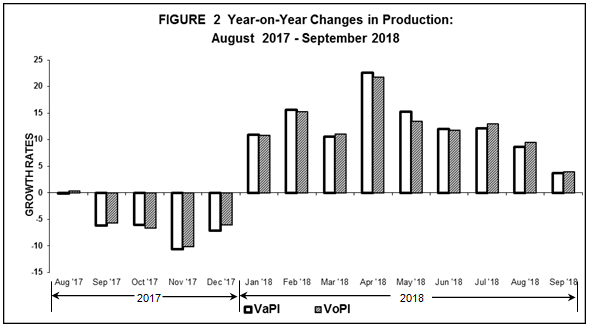
- Value of Production Index accelerates in September 2018
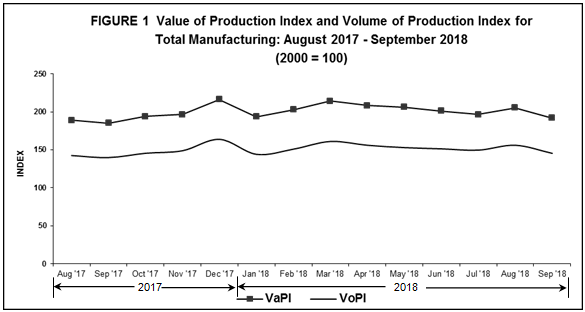
The Value of Production Index (VaPI) for manufacturing rose by 3.7 percent in September 2018 compared with the negative growth rate of 6.2 percent in the same month of the previous year, based from the preliminary results of the Monthly Integrated Survey of Selected Industries (MISSI).
Significant increases in VaPI were attributed to the eight major industry groups that exhibited two-digit growth, namely: textiles (51.3%), petroleum products (50.3%), miscellaneous manufactures (21.5%), machinery except electrical (18.2%), transport equipment (17.7%), electrical machinery (17.4%), paper and paper products (16.7%) and beverages (13.6%). Refer to Tables1-A and 1.
- Volume of Production Index posts increases
The Volume of Production Index (VoPI) registered a positive growth rate of 4.0 percent in September 2018 compared with the 5.7 percent decrement during the same month of the previous year.
The increase was brought about by the increments noted in 11 major industries, with six industry groups registering two-digit increases in VoPI as follows: textiles (44.7%), petroleum products (26.7%), machinery except electrical (20.1%), miscellaneous manufactures (16.5%), transport equipment (16.2%) and non-metallic mineral products (13.3%). Refer to Tables 1-B and 2.
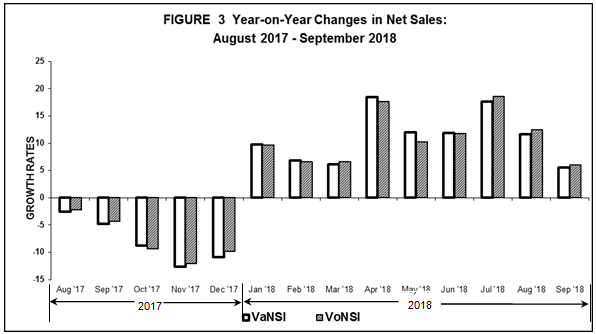
- Value of Net Sales Index sustains a positive growth
The Value of Net Sales Index (VaNSI) depicted an annual increment of 5.6 percent in September 2018 from a decrement of 4.8 percent in the same month of 2017.
Thirteen of the 20 major industries contributed to the growth in VaNSI with significant increases posted by the following: petroleum products (28.1%), wood and wood products (21.9%), paper and paper products (19.2%), miscellaneous manufactures (18.6%) and tobacco products (15.9%). Refer to Tables 2-A and 3.
- Volume of Net Sales Index, likewise, grows
The Volume of Net Sales Index (VoNSI) in September 2018 recorded an increase of 6.0 percent from a decline of 4.3 percent during the same month of the previous year.
Eleven major industries showed increases in VoNSI, with four major industry groups primarily contributing to the growth, namely: wood and wood products (25.9%), paper and paper products (14.3%), furniture and fixtures (14.1%) and non-metallic mineral products (11.9%). Refer to Tables 2-B and 4.
Average Capacity Utilization Rate in September 2018 is 84.2 percent with petroleum products posting the highest among the industries
Average capacity utilization rate in September 2018 for total manufacturing was recorded at 84.2 percent. Fifty-five percent or 11 of the 20 major industries operated at least 80 percent capacity utilization rates. These are:
- petroleum products (89.7%)
- basic metals (89.0%)
- non-metallic mineral products (86.4%)
- machinery except electrical (86.0%)
- chemical products (85.2%)
- electrical machinery (85.1%)
- food manufacturing (84.8%)
- paper and paper products (83.7%)
- rubber and plastic products (83.3%)
- wood and wood products (81.5%)
- textiles (80.3%)
The proportion of establishments that operated at full capacity (90% to 100%) was more than one-fourth of the total number of establishments (26.6%) in September 2018. About 55.1 percent of the total establishments operated at 70 percent to 89 percent capacity while almost one-fifth of the total establishments (18.3%) operated below 70 percent capacity. Refer to Tables B and 6.
|
Table B Distribution of Key Manufacturing Establishments by Capacity Utilization for Total Manufacturing: September 2018 |
|
|---|---|
|
Capacity Utilization |
Percent Share |
|
Below 50% |
3.6 |
|
50% - 59% |
4.5 |
|
60% - 69% |
10.2 |
|
70% - 79% |
21.6 |
|
80% - 89% |
33.5 |
|
90% - 100% |
26.6 |
LISA GRACE S. BERSALES, Ph. D.
Undersecretary
National Statistician and Civil Registrar General
TABLE 1-A Value of Production Index, August 2018 and September 2018
(2000 =100)
|
Industry Group |
Year-on-Year Growth (%) |
|
| September 2018 |
August 2018
(revised)
|
|
|
Gainers |
|
|
|
Petroleum products |
50.3 |
60.9 |
|
Electrical machinery |
17.4 |
18.3 |
|
Machinery except electrical |
18.2 |
21.5 |
|
Textiles |
51.3 |
46.3 |
|
Transport equipment |
17.7 |
3.2 |
|
Beverages |
13.6 |
43.0 |
|
Chemical products |
8.4 |
-6.0 |
|
Miscellaneous manufactures |
21.5 |
30.2 |
|
Paper and paper products |
16.7 |
25.5 |
|
Basic Metals |
6.7 |
5.8 |
|
Losers |
|
|
|
Food manufacturing |
-11.2 |
1.7 |
|
Printing |
-68.6 |
-66.9 |
|
Tobacco products |
-24.4 |
-35.1 |
|
Fabricated metal products |
-26.5 |
-19.9 |
|
Footwear and wearing apparel |
-12.5 |
-6.7 |
|
Rubber and plastic products |
-6.9 |
9.0 |
|
Furniture and fixtures |
-5.9 |
-5.0 |
|
Non-metallic mineral products |
-0.6 |
-1.7 |
|
Leather products |
-6.1 |
-3.0 |
|
Wood and wood products |
-0.9 |
6.6 |
TABLE 1-B Volume of Production Index, August 2018 and September 2018
(2000 = 100)
|
Industry Group |
Year-on-Year Growth (%) |
|
| September 2018 |
August 2018
(revised)
|
|
|
Gainers |
|
|
|
Petroleum products |
26.7 |
37.9 |
|
Machinery except electrical |
20.1 |
24.8 |
|
Electrical machinery |
8.9 |
11.1 |
|
Textiles |
44.7 |
39.7 |
|
Transport equipment |
16.2 |
2.0 |
|
Chemical products |
8.9 |
-4.7 |
|
Non-metallic mineral products |
13.3 |
11.1 |
|
Miscellaneous manufactures |
16.5 |
25.6 |
|
Paper and paper products |
9.2 |
21.4 |
|
Furniture and fixtures |
6.2 |
7.0 |
|
Wood and wood products |
2.9 |
8.5 |
|
Losers |
|
|
|
Food manufacturing |
-10.7 |
1.7 |
|
Tobacco products |
-50.4 |
-57.6 |
|
Printing |
-69.9 |
-68.3 |
|
Footwear and wearing apparel |
-13.9 |
-6.1 |
|
Fabricated metal products |
-23.7 |
-13.6 |
|
Rubber and plastic products |
-6.1 |
10.3 |
|
Basic metals |
-0.5 |
-1.7 |
|
Leather products |
-4.2 |
3.9 |
|
Beverages |
-0.1 |
25.7 |
(2000 =100)
|
Industry Group |
Year-on-Year Growth (%) |
|
| September 2018 |
August 2018
(revised)
|
|
|
Gainers |
|
|
|
Petroleum products |
28.1 |
36.0 |
|
Food manufacturing |
6.8 |
15.9 |
|
Machinery except electrical |
7.7 |
10.8 |
|
Electrical machinery |
2.8 |
11.9 |
|
Basic metals |
8.5 |
13.9 |
|
Miscellaneous manufactures |
18.6 |
17.9 |
|
Paper and paper products |
19.2 |
26.2 |
|
Transport equipment |
8.0 |
-1.0 |
|
Tobacco products |
15.9 |
25.1 |
|
Beverages |
4.4 |
25.1 |
|
Wood and wood products |
21.9 |
17.4 |
|
Furniture and fixtures |
4.6 |
8.6 |
|
Rubber and plastic products |
2.8 |
14.2 |
|
Losers |
|
|
|
Chemical products |
-7.2 |
-6.6 |
|
Textiles |
-24.4 |
-20.7 |
|
Fabricated metal products |
-26.8 |
4.0 |
|
Printing |
-7.2 |
-11.9 |
|
Leather products |
-17.6 |
-15.7 |
|
Non-metallic mineral products |
-0.7 |
-1.1 |
|
Footwear and wearing apparel |
-0.6 |
11.8 |
TABLE 2-B Volume of Net Sales Index, August 2018 and September 2018
(2000 = 100)
|
Industry Group |
Year-on-Year Growth (%) |
|
| September 2018 |
August 2018
(revised)
|
|
|
Gainers |
|
|
|
Food manufacturing |
9.8 |
18.5 |
|
Petroleum products |
7.1 |
15.5 |
|
Machinery except electrical |
6.7 |
10.9 |
|
Transport equipment |
9.1 |
1/ |
|
Non-metallic mineral products |
11.9 |
10.6 |
|
Paper and paper products |
14.3 |
25.1 |
|
Miscellaneous manufactures |
8.0 |
8.0 |
|
Wood and wood products |
25.9 |
18.9 |
|
Furniture and fixtures |
14.1 |
18.2 |
|
Rubber and plastic products |
6.3 |
18.4 |
|
Basic metals |
1.4 |
6.2 |
|
Losers |
|
|
|
Electrical machinery |
-5.3 |
4.3 |
|
Chemical products |
-5.6 |
-4.2 |
|
Textiles |
-27.4 |
-24.0 |
|
Tobacco products |
-23.6 |
-17.6 |
|
Beverages |
-9.6 |
8.3 |
|
Fabricated metal products |
-24.0 |
12.2 |
|
Printing |
-11.0 |
-15.5 |
|
Footwear and wearing apparel |
-1.7 |
12.9 |
|
Leather products |
-15.7 |
-9.1 |