Release Date :
Reference Number :
2013-091
Population of Surigao del Norte increased at the rate of 1.68 percent annually
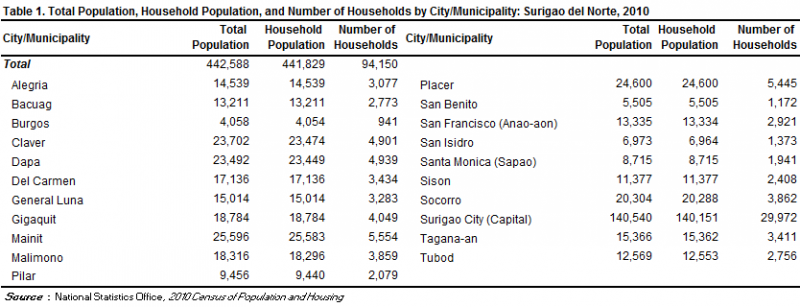
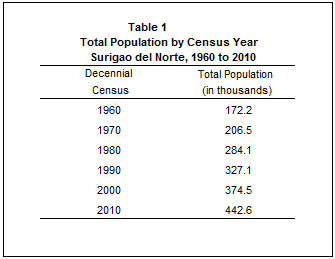
Based on the 2010 Census of Population and Housing (CPH), the province of Surigao del Norte posted a total population of 442,588 persons as of May 1, 2010. This is larger by 68,123 persons compared to its total population of 374,465 persons counted in the 2000 CPH. The increase in the population count from 2000 to 2010 translated to an average annual population growth rate (PGR) of 1.68 percent. This is higher than the 1.36 percent annual PGR of the province between the census years 1990 and 2000.
If the average annual PGR recorded at 1.68 percent during the period 2000 to 2010 continues, the population of Surigao del Norte would double in 42 years.
Fifty years ago, the population of Surigao del Norte was only 172,220 persons. This population size is more than one third of the population of the province in the 2010 CPH.
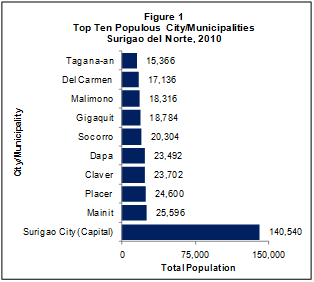
Surigao City was the most populous
Among the lone city and 20 municipalities comprising the province of Surigao del Norte, Surigao City, the provincial capital, was the most populous with a population size making up 31.8 percent of the total provincial population. The municipality of Mainit was the second most populous with 5.8 percent share, followed by the municipalities of Placer with 5.6 percent, Claver with 5.4 percent, and Dapa with 5.3 percent. The rest of municipalities contributed less than 5.0 percent each.
The least populated area was the municipality of Burgos with 0.9 percent share to the total population of the province. It was also the least populated area in 2000.
Sex ratio was 103 males per 100 females
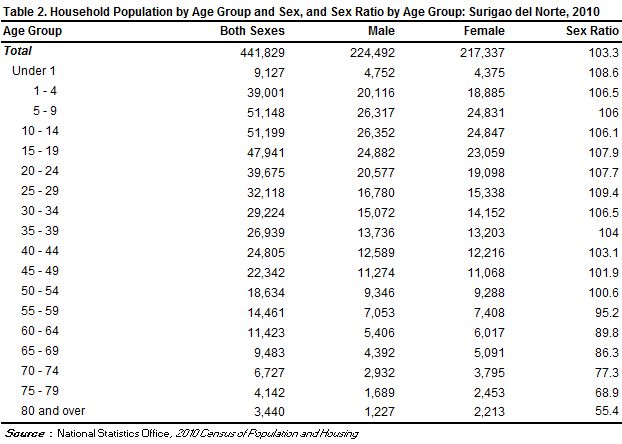
Of the 441,829 household population in 2010, males accounted for 50.8 percent while females comprised 49.2 percent. These figures resulted in a sex ratio of 103 males for every 100 females, which is similar to the sex ratio recoded in 2000 (102 males per 100 females).
Median age increased to 22.8 years
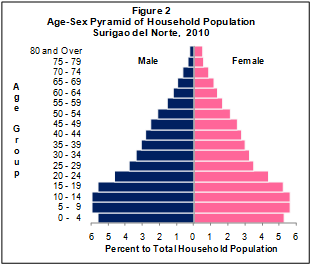
In 2010, the median age of the population of the province was 22.8 years, which means that half of the population was younger than 22.8 years. This is higher than the median age of 20.0 years that was recorded in 2000.
Moreover, 34.1 percent of the household population were under 15 years old. Children aged 5 to 9 years and 10 to 14 years (11.6 percent each) comprised the largest age group, followed by those in the age group 0 to 4 years (10.9 percent). Males outnumbered females in the age groups 0 to 54 years. On the other hand, there were more females than males in the older age groups (55 years and over).
About 60.0 percent of the population were of voting age
The voting-age population (18 years and over) accounted for 59.4 percent of the household population of the province in 2010, up from 53.8 percent in 2000. There were more males (50.3 percent) than females (49.7 percent) among the voting-age population.
Dependency ratio decreased to 65 dependents per 100 persons in the working age group
In 2010, the young dependents (0 to 14 years) comprised 34.1 percent of the household population while the old dependents (65 years and over) posted a share of 5.4 percent. The working-age population (15 to 64 years) accounted for the remaining 60.6 percent.
The overall dependency ratio was 65, which indicates that for every 100 working-age population, there were about 65 dependents (56 young dependents and nine old dependents). This ratio is lower than the dependency ratio in 2000, which was recorded at 78 dependents per 100 working-age population (70 young dependents and eight old dependents).
There were more males than females among the never-married persons
Of the household population 10 years old and over, 44.9 percent were married while 43.9 percent were never married. The rest of the populations were categorized as follows: in common-law/live-in marital arrangement (5.4 percent), widowed (4.6 percent), and divorced/separated (1.0 percent).
Among the never-married persons, 54.8 percent were males while 45.2 percent were females. For the rest of the categories for marital status, the females outnumbered the males.
More females had attained higher levels of education
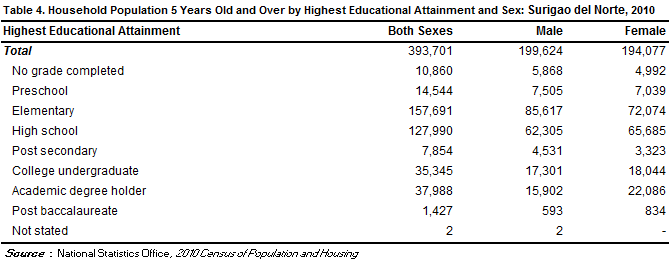
Of the household population aged five years and over, 40.1 percent had attended or completed elementary education, 32.5 percent had reached or finished high school, 9.0 percent were college undergraduates, and 9.6 percent were academic degree holders. Among those with an academic degree, the females (58.1 percent) outnumbered the males (41.9 percent). Similarly, more females (58.4 percent) than males (41.6 percent) had pursued post baccalaureate courses.
Persons with disability comprised 1.9 percent of the population in the province
In 2010, around 8,300 persons or 1.9 percent of the 441,829 household population had a disability. This proportion of persons with disability (PWD) is similar to the proportion in 2000, which was 1.8 percent of the 373,794 household population of the province during that year. The number of PWD for the same year was around 6,800.
More females than males among those with functional difficulty
Of the 393,701 household population five years and over, 3.9 percent (or 15,308 persons) had at least one type of functional difficulty either in seeing, hearing, walking or climbing steps, remembering or concentrating, self-caring (bathing or dressing), or communicating. There were more females (51.6 percent) than males (48.4 percent) among those persons with at least one type of functional difficulty.
Moreover, of the total 15,308 persons aged five years and over with at least one type of functional difficulty, 68.1 percent reported difficulty in seeing, even if wearing eyeglasses. There were 23.4 percent who had difficulty in walking or climbing steps; 20.0 percent had difficulty in hearing, even if using a hearing aid; 17.1 percent had difficulty in remembering or concentrating; 11.3 percent had difficulty in communicating; and 9.8 percent had difficulty in self-caring (bathing or dressing).
Male overseas workers outnumbered their female counterparts
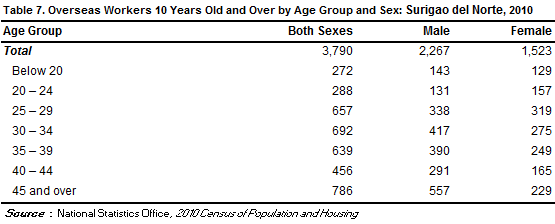
Of the 342,553 household population 10 years old and over in Surigao del Norte, 1.1 percent (or 3,790 persons) were overseas workers. Male overseas workers outnumbered their female counterparts as they comprised 59.8 percent of all the overseas workers from this province. Overseas workers aged 45 years and over made up the largest age group, comprising 20.7 percent of the total overseas workers from this province in 2010, followed by the age groups 30 to 34 years (18.3 percent), 25 to 29 years (17.3 percent), and 35 to 39 years (16.9 percent).
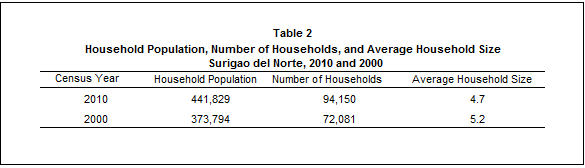
Average household size was 4.7 persons
The number of households in 2010 was recorded at 94,150, higher by 22,069 households compared with the 72,081 households posted in 2000. The average household size in 2010 was 4.7 persons, lower than the average household size of 5.2 persons in 2000.
There were 102 households per 100 occupied housing units
A total of 91,950 occupied housing units were recorded in the province of Surigao del Norte in 2010. This translates to a ratio of 102 households for every 100 occupied housing units, with 4.8 persons per occupied housing unit. In 2000, there were 102 households per 100 occupied housing units, and 5.3 persons per occupied housing unit.
Occupied housing units with outer walls and roofs made of strong materials increased
In 2010, 36.2 percent of the occupied housing units in the province had outer walls made of wood, lower than the proportion of 47.5 percent recorded in 2000. The proportion of occupied housing units with outer walls made of concrete/brick/stone increased from 22.2 percent in 2000 to 35.1 percent in 2010. Meanwhile, 57.9 percent of the occupied housing units in 2010 had roofs made of galvanized iron/aluminum, higher than the proportion of 42.6 percent recorded in 2000. The proportion of occupied housing units with roofs made of cogon/nipa/anahaw decreased from 50.7 percent in 2000 to 36.2 percent in 2010.
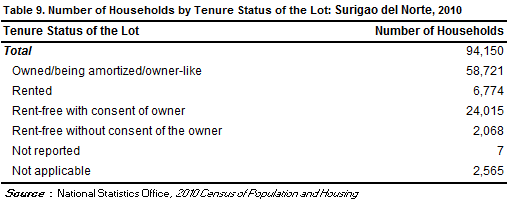
Majority of the households lived in lots that they owned or amortized
In 2010, of the total 94,150 households, about 62.4 percent were owned or amortized the lots that they occupied. The corresponding figure in 2000 was 53.8 percent.
Moreover, more than one fourth (25.5 percent) of the households occupied lots which were rent-free but with consent of the owner, 7.2 percent rented the lots that they occupied while 2.2 percent occupied lots which were rent-free but without consent of the owner.
(Sgd) CARMELITA N. ERICTA
Administrator