Population of Palawan (excluding Puerto Princesa City) increased at the rate of 2.66 percent annually
Based on the 2010 Census of Population and Housing (CPH), the province of Palawan, excluding Puerto Princesa City, posted a total population of 771,667 persons as of May 1, 2010. This is larger by 178,167 persons compared to its total population of 593,500 persons counted in the 2000 CPH. The increase in the population count from 2000 to 2010 translated to an average annual population growth rate (PGR) of 2.66 percent. This is lower than the 3.13 percent annual PGR of the province between the census years 1990 and 2000.
If the average annual PGR recorded at 2.66 percent during the period 2000 to 2010 continues, the population of Palawan would double in 26 years.
Fifty years ago, the population of Palawan was only 139,544 persons. This population size is less than one fifth of the population of the province in the 2010 CPH.

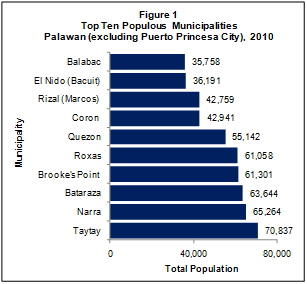
Municipality of Taytay was the most populous
Among the 23 municipalities comprising the province of Palawan, the municipality of Taytay was the most populous with a population size making up 9.2 percent of the total provincial population. The municipality of Narra, was second with 8.5 percent share, followed by the municipalities of Bataraza (8.2 percent), Brooke’s Point (7.9 percent), Roxas (7.9 percent), and Quezon (7.1 percent). The rest of the municipalities contributed less than 7.0 percent each.
The least populated area was the municipality of Kalayaan with 0.03 percent share to the total population of the province. It was also the least populated municipality in 2000.
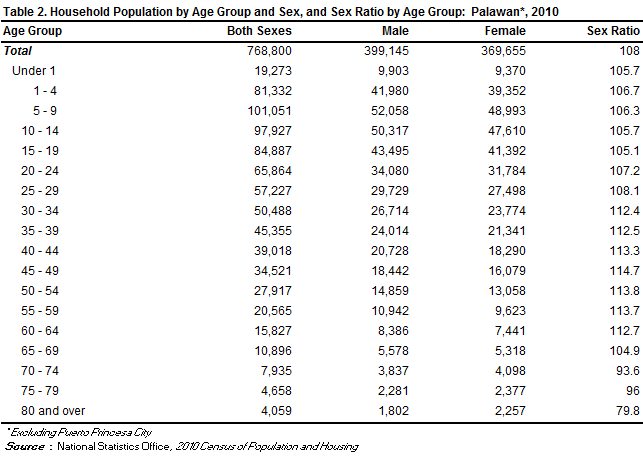
Sex ratio was 108 males per 100 females
Of the 768,800 household population in 2010, males accounted for 51.9 percent while females comprised 48.1 percent. These figures resulted in a sex ratio of 108 males for every 100 females, which is similar to the sex ratio recorded in 2000 (107 males per 100 females).
Median age increased to 20.0 years
In 2010, the median age of the population of the province was 20.0 years, which means that half of the population was younger than 20.0 years. This is higher than the median age of 18.2 years that was recorded in 2000.
Moreover, four in every 10 persons (39.0 percent) were under 15 years old. Children aged 0 to 4 years and 5 to 9 years (13.1 percent each) comprised the largest age group, followed closely by those in the age group 10 to 14 years (12.7 percent). Males outnumbered females in the age groups 0 to 69 years. On the other hand, there were more females than males in the older age groups (70 years and over).

More than half of the population were of voting age
The voting-age population (18 years and over) accounted for 54.2 percent of the household population of the province in 2010, up from 50.9 percent in 2000. There were more males (52.3 percent) than females (47.7 percent) among the voting-age population.
Dependency ratio decreased to 74 dependents per 100 persons in the working age group
In 2010, the young dependents (0 to 14 years) comprised 39.0 percent of the household population while the old dependents (65 years and over) posted a share of 3.6 percent. The working-age population (15 to 64 years) accounted for the remaining 57.4 percent.
The overall dependency ratio was 74, which indicates that for every 100 working-age population, there were about 74 dependents (68 young dependents and six old dependents). This ratio is lower than the dependency ratio in 2000, which was recorded at 84 dependents per 100 working-age population (78 young dependents and six old dependents).
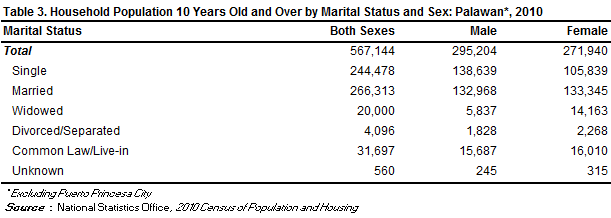
There were more males than females among the never-married persons
Of the household population 10 years old and over, 47.0 percent were married while 43.1 percent were never married. The rest of the population were categorized as follows: in common-law/live-in marital arrangement (5.6 percent), widowed (3.5 percent), and divorced/separated (0.7 percent).
Among the never-married persons, 56.7 percent were males while 43.3 percent were females. For the rest of the categories for marital status, the females outnumbered the males.
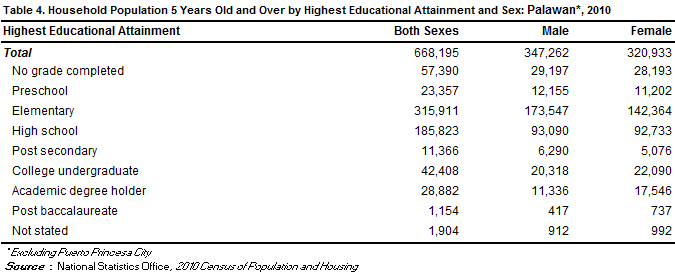
More females had attained higher levels of education
Of the household population aged five years and over, 47.3 percent had attended or completed elementary education, 27.8 percent had reached or finished high school, 6.3 percent were college undergraduates, and 4.3 percent were academic degree holders. Among those with an academic degree, the females (60.8 percent) outnumbered the males (39.2 percent). Similarly, more females (63.9 percent) than males (36.1 percent) had pursued post baccalaureate courses.
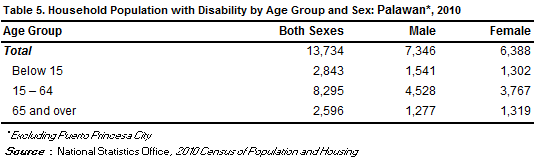
Persons with disability comprised 1.8 percent of the population in the province
In 2010, around 13,700 persons or 1.8 percent of the 768,800 household population had a disability. The proportion of persons with disability (PWD) in 2000 was 1.4 percent of the 592,792 household population of the province during that year. The number of PWD for the same year was around 8,200.
There were more males than females among those with functional difficulty
Of the 668,195 household population five years and over, 3.8 percent (or 25,556 persons) had at least one type of functional difficulty either in seeing, hearing, walking or climbing steps, remembering or concentrating, self-caring (bathing or dressing), or communicating. There were more males (51.8 percent) than females (48.2 percent) among those persons with at least one type of functional difficulty.
Moreover, of the total 25,556 persons aged five years and over with at least one type of functional difficulty, 73.9 percent reported difficulty in seeing, even if wearing eyeglasses. There were 22.7 percent who had difficulty in hearing, even if using a hearing aid; 22.6 percent had difficulty in walking or climbing steps; 12.0 percent had difficulty in remembering or concentrating; 9.3 percent had difficulty in self-caring (bathing or dressing); and 9.2 percent had difficulty in communicating.
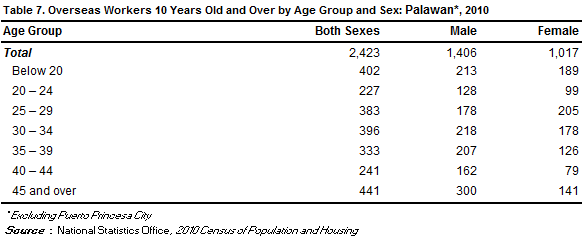
Male overseas workers outnumbered their female counterparts
Of the 567,144 household population 10 years old and over in Palawan, 0.4 percent (or 2,423 persons) were overseas workers. Male overseas workers outnumbered their female counterparts as they comprised 58.0 percent of all overseas workers from this province. Overseas workers aged 45 years old and over made up the largest age group, comprising 18.2 percent of the total overseas workers from this province in 2010, followed by the age groups 30 to 34 years (16.3 percent), 25 to 29 years (15.8 percent) and 35 to 39 years (13.7 percent).
Average household size was 4.7 persons
The number of households in 2010 was recorded at 165,272, higher by 47,583 households compared with the 117,689 households posted in 2000. The average household size in 2010 was 4.7 persons, lower than the average household size of 5.0 persons in 2000.

There were 101 households per 100 occupied housing units
A total of 164,203 occupied housing units were recorded in the province of Palawan in 2010. This translates to a ratio of 101 households for every 100 occupied housing units, with 4.7 persons per occupied housing unit. In 2000, there were 101 households per 100 occupied housing units, and 5.1 persons per occupied housing unit.
Occupied housing units with outer walls and roofs made of light materials decreased
In 2010, 69.3 percent of the occupied housing units in the province had outer walls made of bamboo/sawali/cogon/nipa, down from 77.4 percent in 2000. The proportion of occupied housing units with outer walls made of half concrete/brick/stone and half wood increased from 8.7 percent in 2000 to 11.5 percent in 2010. Those with walls made of concrete/brick/stone increased from 5.8 percent to 11.4 percent. Meanwhile, majority (60.1 percent) of the occupied housing units in 2010 had roofs made of cogon/nipa/anahaw. This is lower than the proportion recorded in 2000 at 72.5 percent.
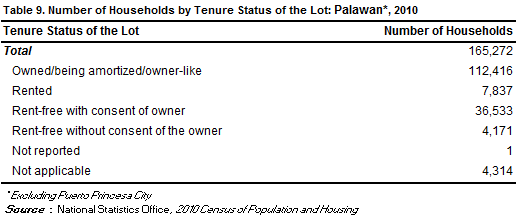
Majority of the households lived in lots that they owned or amortized
In 2010, of the total 165,272 households, 68.0 percent owned or amortized the lots that they occupied. The corresponding figure in 2000 was lower at 65.6 percent.
Moreover, 22.1 percent of the households occupied lots which were rent-free but with consent of the owner, 4.7percent rented the lots that they occupied while 2.5 percent occupied lots which were rent-free but without consent of the owner.