Release Date :
Reference Number :
2013-123
Population of Mountain Province increased at the rate of 0.94 percent annually
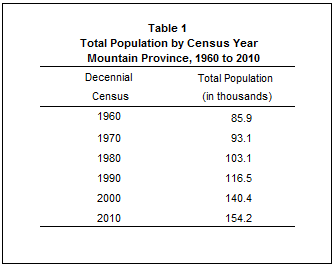
Based on the 2010 Census of Population and Housing (CPH), the province of Mountain Province posted a total population of 154,187 persons as of May 1, 2010, larger by 13,748 persons compared to its total population of 140,439 persons counted in the 2000 CPH. The increase in the population count from 2000 to 2010 translated to an average annual population growth rate (PGR) of 0.94 percent. This is lower than the 1.88 percent annual PGR of the province between the census years 1990 and 2000.
If the average annual PGR recorded at 0.94 percent during the period 2000 to 2010 continues, the population of Mountain Province would double in 75 years.
Fifty years ago, the population of Mountain Province was only 85,866 persons. This population size is more than one half of the population of the province in the 2010 CPH.
Bauko was the most populous municipality
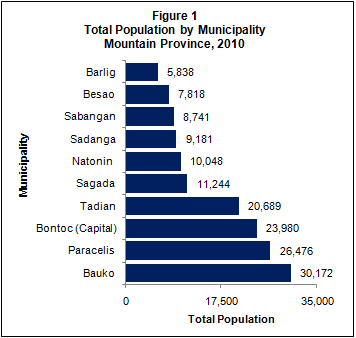
Among the 10 municipalities comprising Mountain Province, the municipality of Bauko was the most populous with a population size making up 19.6 percent of the total provincial population. The municipality of Paracelis was second with 17.2 percent share, followed by the municipalities of Bontoc, the provincial capital, with 15.6 percent, Tadian with 13.4 percent, Sagada with 7.3 percent, Natonin with 6.5 percent, Sadanga with 6.0 percent, Sabangan with 5.7 percent, Besao with 5.1 percent, and Barlig with 3.8 percent.
In 2000, the least populated municipality was also Barlig with 4.5 percent share to the total population of the province.
Sex ratio was 106 males per 100 females
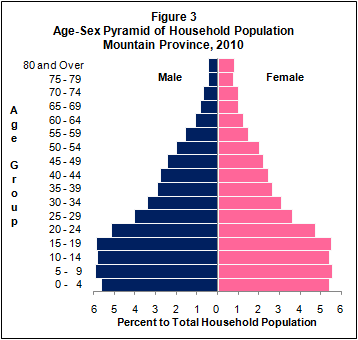
Of the 154,063 household population in 2010, males accounted for 51.5 percent while females comprised 48.5 percent. These figures resulted in a sex ratio of 106 males for every 100 females. In 2000, the recorded sex ratio was the same as that in 2010.
Median age increased to 22.5 years
In 2010, the median age of the population of the province was 22.5 years, which means that half of the population was younger than 22.5 years. This is higher than the median age of 20.4 years that was recorded in 2000.
Moreover, one in every three persons (33.8 percent) were under 15 years old. Children aged 5 to 9 years (11.5 percent) comprised the largest age group, followed by those in the age groups 15 to 19 years (11.4 percent) and 10 to 14 years (11.2 percent). Males outnumbered females in the age groups 0 to 59 years. On the other hand, there were more females than males in the older age groups (60 years and over).
Three fifths of the population were of voting age
The voting-age population (18 years and over) accounted for 59.4 percent of the household population of the province in 2010, up from 54.7 percent in 2000. There were more males (51.3 percent) than females (48.7 percent) among the voting-age population.
Dependency ratio decreased to 66 dependents per 100 persons in the working age group
In 2010, the young dependents (0 to 14 years) comprised 33.8 percent of the household population while the old dependents (65 years and over) posted a share of 6.0 percent. The working-age population (15 to 64 years) accounted for the remaining 60.2 percent.
The overall dependency ratio was 66, which indicates that for every 100 working-age population, there were about 66 dependents (56 young dependents and 10 old dependents). This ratio is lower than the dependency ratio in 2000, which was recorded at 79 dependents per 100 working-age population (69 young dependents and 10 old dependents).
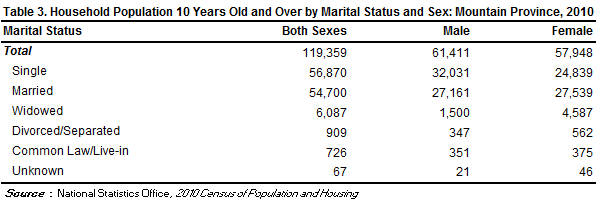
There were more males than females among the never-married persons
Of the household population 10 years old and over, 47.6 percent were never married while 45.8 percent were married. The rest of the population were categorized as follows: widowed (5.1 percent), divorced/separated (0.8 percent), and in common law/live in marital arrangement (0.6 percent).
Among the never-married persons, 56.3 percent were males while 43.7 percent were females. For the rest of the categories for marital status, the females outnumbered the males.
More females had attained higher levels of education
Of the household population aged five years and over, 36.0 percent had attended or completed elementary education, 28.4 percent had reached or finished high school, 11.7 percent were college undergraduates and 11.2 percent were academic degree holders. Females outnumbered males among those with higher levels of education as they comprised 64.8 percent of all those with an academic degree and 65.5 percent of all those who pursued post baccalaureate course.
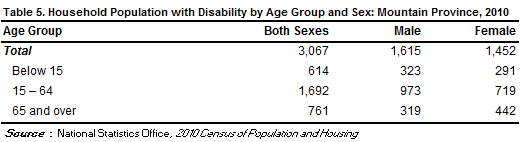
Persons with disability comprised 2.0 percent of the population in the province
In 2010, around 3,100 persons or 2.0 percent of the 154,063 household population had a disability. The proportion of persons with disability (PWD) in 2000 was 1.4 percent of the 140,531 household population of the province during that year. The number of PWD for the same year was around 1,900.
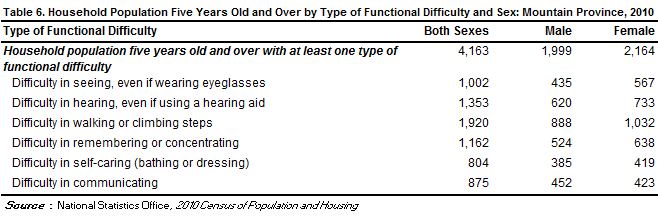
More females than males among those with functional difficulty
Of the 137,064 household population five years old and over, 3.0 percent (or 4,163 persons) had at least one type of functional difficulty either in seeing, hearing, walking or climbing steps, remembering or concentrating, self-caring (bathing or dressing) or communicating. There were more females (52.0 percent) than males (48.0 percent) among those persons with at least one type of functional difficulty.
Moreover, of the total 4,163 persons aged five years old and over with at least one type of functional difficulty, 46.1 percent reported difficulty in walking or climbing steps. There were 32.5 percent who had difficulty in hearing, even if using a hearing aid; 27.9 percent had difficulty in remembering or concentrating; 24.1 percent reported difficulty in seeing, even if wearing eyeglasses; 21.0 percent had difficulty in communicating; 19.3 percent had difficulty in self-caring (bathing or dressing).
Female overseas workers outnumbered their male counterparts
Of the 119,359 household population 10 years old and over in Mountain Province, 2.8 percent (or 3,363 persons) were overseas workers. Female overseas workers outnumbered their male counterparts as they comprised 72.8 percent of all the overseas workers from this province. Overseas workers aged 25 to 29 years made up the largest age group, comprising 23.3 percent of the total overseas workers from this province in 2010, followed by the age groups 30 to 34 (22.6 percent), 35 to 39 years (16.4 percent), and 45 years and over (14.7 percent).
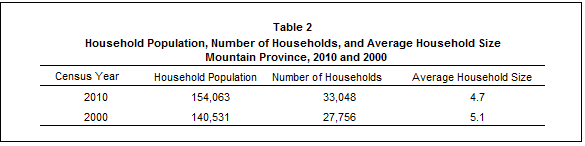
Average household size was 4.7 persons
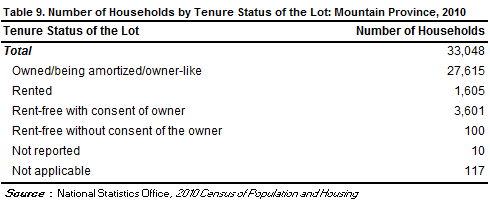
The number of households in 2010 was recorded at 33,048, higher by 5,292 households compared with the 27,756 households posted in 2000. The average household size in 2010 was 4.7 persons, lower than the average household size of 5.1 persons in 2000.
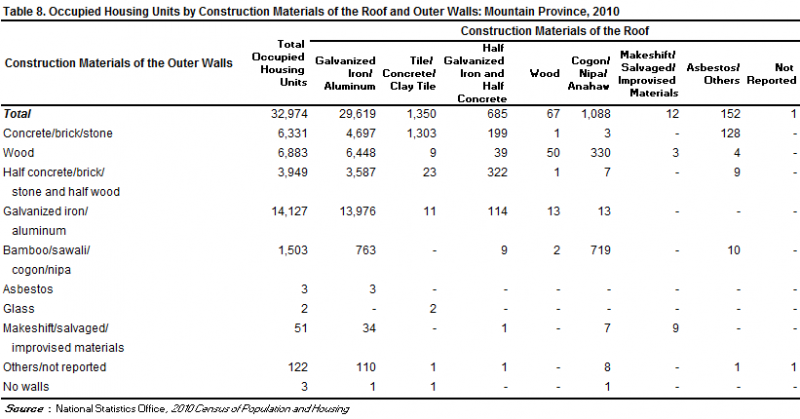
There were 100 households per 100 occupied housing units
A total of 32,974 occupied housing units were recorded in the province of Mountain Province in 2010. This translates to a ratio of 100 households for every 100 occupied housing units, with 4.7 persons per occupied housing unit. In 2000, there were 100 households per 100 occupied housing units and 5.1 persons per occupied housing unit.
Occupied housing units with outer walls and roofs made of strong materials increased
In 2010, 42.8 percent of the occupied housing units in the province had outer walls made of galvanized iron/aluminum, down from 44.6 percent in 2000. The proportion of occupied housing units with outer walls made of wood decreased from 24.0 percent in 2000 to 20.9 percent in 2010. Those with outer walls made of concrete/brick/stone increased from 7.4 percent in 2000 to 19.2 percent in 2010. Meanwhile, 89.8 percent of the occupied housing units in 2010 had roofs made of galvanized iron/aluminum. This is higher than the proportion recorded in 2000 at 79.9 percent. The proportion of occupied housing units with roofs made of tile/concrete/clay tile, on the other hand, increased from 2.2 percent in 2000 to 4.1 percent in 2010.
Majority of the households in the province lived in lots that they owned or amortized
In 2010, 83.6 percent of the total 33,048 households, owned or amortized the lots they occupied. The corresponding figure in 2000 was 80.6 percent of the 27,756 households.
Moreover, 10.9 percent of the households occupied lots which were rent-free but with consent of owner, 4.9 percent rented the lots that they occupied while 0.3 percent occupied lots which were rent-free but without consent of the owner.
(Sgd) CARMELITA N. ERICTA
Administrator