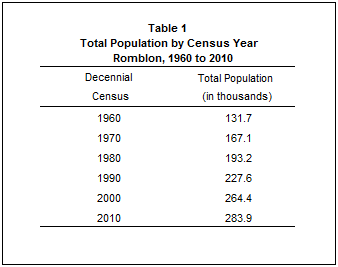
Population of Romblon increased at the rate of 0.72 percent annually
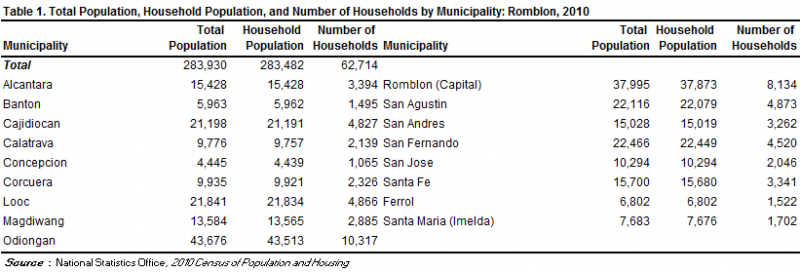
Based on the 2010 Census of Population and Housing (CPH), the province of Romblon posted a total population of 283,930 persons as of May 1, 2010. This is larger by 19,573 persons compared to its total population of 264,357 persons counted in the 2000 CPH. The increase in the population count from 2000 to 2010 translated to an average annual population growth rate (PGR) of 0.72 percent. This is lower than the 1.51 percent annual PGR of the province between the census years 1990 and 2000.
If the average annual PGR recorded at 0.72 percent during the period 2000 to 2010 continues, the population of Romblon would double in 98 years.
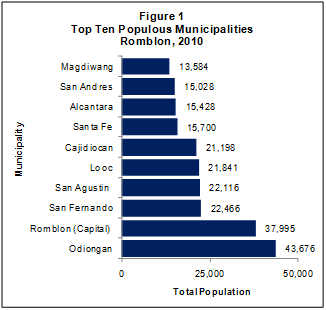
Municipality of Odiongan was the most populous
Among the 17 municipalities comprising the province of Romblon, the municipality of Odiongan was the most populous with a population size making up 15.4 percent of the total provincial population. The municipality of Romblon, the provincial capital, was second with 13.4 percent share, followed by the municipalities of San Fernando (7.9 percent), San Agustin (7.8 percent), Looc (7.7 percent), and Cajidiocan (7.5 percent). The rest of the municipalities contributed less than 6.0 percent each.
Sex ratio increased to 103 males per 100 females
Of the 283,482 household population in 2010, males accounted for 50.8 percent while females comprised 49.2 percent. These figures resulted in a sex ratio of 103 males for every 100 females, which is similar to the sex ratio recorded in 2000 (102 males per 100 females).
Median age increased to 21.7 years
In 2010, the median age of the household population of the province was 21.7 years, which means that half of the population was younger than 21.7 years. This is higher than the median age of 19.5 years that was recorded in 2000.

More than half of the population were of voting age
The voting-age population (18 years and over) accounted for 56.6 percent of the household population of the province in 2010, up from 52.7 percent in 2000. There were more females (50.2 percent) than males (49.8 percent) among the voting-age population in 2010.
Dependency ratio decreased to 75 dependents per 100 persons in the working age group
In 2010, the young dependents (0 to 14 years) comprised 36.4 percent of the household population while the old dependents (65 years and over) posted a share of 6.4 percent. The working-age population (15 to 64 years) accounted for the remaining 57.2 percent.
The overall dependency ratio was 75, which indicates that for every 100 working-age population, there were about 75 dependents (64 young dependents and 11 old dependents). This ratio is lower than the dependency ratio in 2000, which was recorded at 85 dependents per 100 working-age population (75 young dependents and 10 old dependents).
There were more males than females among the never-married persons
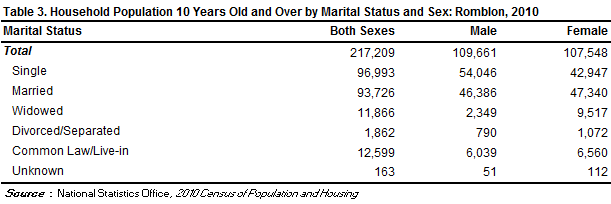
Of the household population 10 years old and over, 44.7 percent were never married while 43.2 percent were married. The rest of the population were categorized as follows: in common-law/live-in marital arrangement (5.8 percent), widowed (5.5 percent), and divorced/separated (0.9 percent).
Among the never-married persons, 55.7 percent were males while 44.3 percent were females. For the rest of the categories for marital status, the females outnumbered the males.
More females had attained higher levels of education
Of the household population aged five years and over, 43.0 percent had attended or completed elementary education, 32.1 percent had reached or finished high school, 7.2 percent were academic degree holder, and 7.0 percent were college undergraduates. Among those with an academic degree, the females (59.0 percent) outnumbered the males (41.0 percent). Similarly, more females (63.2 percent) than males (36.8 percent) had pursued post baccalaureate courses.
Persons with disability comprised 1.7 percent of the population in the province
In 2010, around 4,800 persons or 1.7 percent of the 283,482 household population had a disability. This proportion of persons with disability (PWD) is similar to the proportion in 2000, which was 1.8 percent of the 264,081 household population of the province during that year. The number of PWD for the same year was around 4,900.
There were more females than males among those with functional difficulty
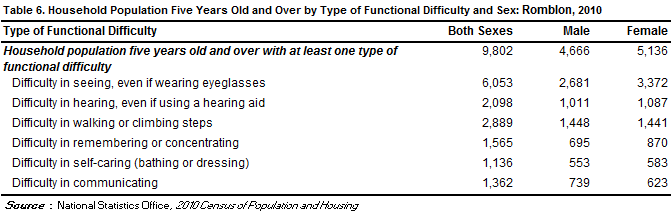
Of the 252,055 household population five years and over, 3.9 percent (or 9,802 persons) had at least one type of functional difficulty either in seeing, hearing, walking or climbing steps, remembering or concentrating, self-caring (bathing or dressing), or communicating. There were more females (52.4 percent) than males (47.6 percent) among those persons with at least one type of functional difficulty.
Moreover, of the total 9,802 persons aged five years and over with at least one type of functional difficulty, 61.8 percent reported difficulty in seeing, even if wearing eyeglasses. There were 29.5 percent had difficulty in walking or climbing steps, 21.4 percent who had difficulty in hearing, even if using a hearing aid, 16.0 percent had difficulty in remembering or concentrating, 13.9 percent had difficulty in communicating, and 11.6 percent had difficulty in self-caring (bathing or dressing).
Male overseas workers outnumbered their female counterparts
Of the 217,209 household population 10 years old and over in Romblon, 0.9 percent (or 2,042 persons) were overseas workers. Male overseas workers outnumbered their female counterparts as they comprised 62.6 percent of all the overseas workers from this province. Overseas workers aged 45 years and over made up the largest age group, comprising 23.6 percent of the total overseas workers from this province in 2010, followed by the age groups 30 to 34 years (17.4 percent), 25 to 29 years (17.2 percent), and 35 to 39 years (17.1 percent).
Average household size was 4.5 persons

There were 101 households per 100 occupied housing units
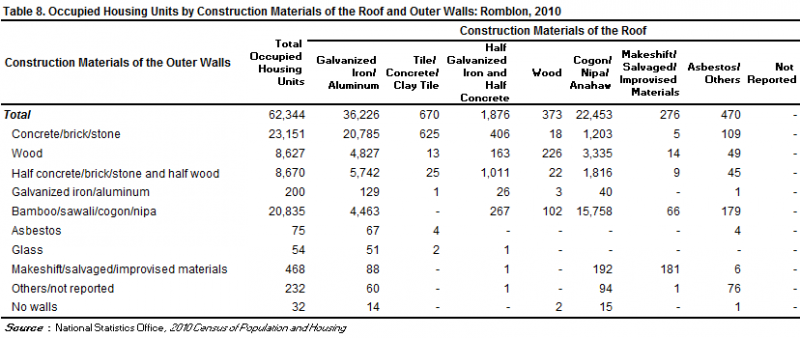
A total of 62,344 occupied housing units were recorded in the province of Romblon in 2010. This translates to a ratio of 101 households for every 100 occupied housing units, with 4.5 persons per occupied housing unit. In 2000, there were 101 households per 100 occupied housing units, and 5.0 persons per occupied housing unit.
Occupied housing units with outer walls and roofs made of strong materials increased
In 2010, 37.1 percent of the occupied housing units in the province had outer walls made of concrete/brick/stone, up from the 25.6 percent in 2000. The proportion of occupied housing units with outer walls made of bamboo/sawali/cogon/nipa decreased from 42.9 percent in 2000 to 33.4 percent in 2010. Meanwhile, 58.1 percent of the occupied housing units in 2010 had roofs made of galvanized iron/aluminum, up from 37.1 percent in 2000. Those with roofs made of cogon/nipa/anahaw decreased from 55.0 percent in 2000 to 36.0 percent in 2010.
Two thirds of the households lived in lots that they owned or amortized
In 2010, of the total 62,714 households in the province, 66.5 percent owned or amortized the lots that they occupied. The corresponding figure in 2000 was 58.6 percent.
Moreover, 29.4 percent of the households occupied lots which were rent-free but with consent of the owner, 2.8 percent rented the lots that they occupied while 0.6 percent occupied lots which were rent-free but without consent of the owner.