
Table A Year-on-Year and Month-on-Month Growth Rates of Producer Price Index: August 2013 and July 2013 | ||
|---|---|---|
TOTAL MANUFACTURING | August 2013 | July 2013 |
| Producer Price Index (2000=100) | 153.7 | 151.7 |
| Year-on-Year Growth | -5.9 | -6.2 r |
| Month-on-Month Growth | 1.3 | -1.2 |
r - revised
- Producer Price Index maintains a negative annual rate
Producer Price Index (PPI, 2000=100) for manufacturing slowly decelerated to 5.9 percent in August 2013 from negative 6.2 percent in July 2013, compared with the year ago level, according to the preliminary results of the Monthly Producer Price Survey. Ten major sectors pulled down the PPI led by furniture and fixtures which further decreased to 44.5 percent from negative 33.4 in July 2013. The other two sectors that posted double-digit decrements were: rubber and plastic products (-12.3%) and basic metals (-11.9%). On the other hand, ten sectors posted increases led by printing (8.4%). Refer to Tables 1 and A-1.
On a monthly basis, PPI went up to 1.3 percent in August 2013 from negative 1.2 percent in July 2013. Fourteen major sectors contributed to the increase led by petroleum products (5.1%). On the other hand, three sectors posted flat growths while three sectors reflected decrements. Refer to Tables 1 and A-2
TABLE A-1 Producer Price Index, July 2013 – August 2013
(2000 =100)
Gainers | Year-on-Year Growth (percent) | |
|---|---|---|
August 2013 | July 2013 (revised) | |
| Petroleum Products | 3.6 | 5.5 |
| Electrical Machinery | 1.8 | 0.0 |
| Beverages | 5.5 | 5.5 |
| Miscellaneous Manufactures | 5.2 | 2.3 |
| Footwear and Wearing Apparel | 4.4 | 6.7 |
| Printing | 8.4 | 9.0 |
| Non-Metallic Mineral Products | 1.9 | 2.0 |
| Wood & Wood Products | 2.3 | 2.2 |
| Textiles | 1.6 | 1.6 |
| Leather Products | 1.3 | 1.2 |
Losers | Year-on-Year Growth (percent) | |
|---|---|---|
| August 2013 | July 2013 (revised) | |
| Machinery Except Electrical | -9.1 | -10.2 |
| Food Manufacturing | -7.1 | -8.0 |
| Basic Metals | -11.9 | -13.8 |
| Transport Equipment | -6.4 | -6.0 |
| Rubber and Plastic Products | -12.3 | -12.9 |
| Furniture and fixtures | -44.5 | -33.4 |
| Chemical Products | -3.2 | -6.5 |
| Tobacco Products | -7.1 | -7.1 |
| Paper and Paper Products | -4.2 | -1.5 |
| Fabricated Metal Products | -2.4 | -0.1 |
TABLE A-2 Producer Price Index, July 2013 – August 2013
(2000 = 100)
Gainers | Month-on-Month Growth (percent) | |
|---|---|---|
| August 2013 | July 2013 (revised) | |
| Petroleum Products | 5.1 | -1.3 |
| Electrical Machinery | 2.4 | -1.1 |
| Machinery Except Electrical | 2.0 | 0.1 |
| Food Manufacturing | 0.9 | 0.3 |
| Basic Metals | 0.9 | -0.9 |
| Transport Equipment | 1.0 | -0.3 |
| Miscellaneous Manufactures | 2.5 | -2.0 |
| Non-Metallic Mineral Products | 0.5 | -0.2 |
| Rubber and Plastic Products | 0.3 | -0.1 |
| Furniture & Fixtures | 1.0 | -16.3 |
| Wood & Wood Products | 0.4 | 0.1 |
| Paper and Paper Products | 0.2 | 1.4 |
| Textiles | 0.3 | 1.3 |
| Leather Products | 0.1 | 0.0 |
| Beverages | 0.0 | 0.0 |
| Printing | 0.0 | 0.0 |
| Tobacco | 0.0 | 0.0 |
Losers | Month-on-Month Growth (percent) | |
|---|---|---|
August 2013 | July 2013 (revised) | |
| Chemical Products | -0.6 | -1.3 |
| Fabricated Metal Products | -1.4 | -0.4 |
| Footwear and Wearing Apparel | -0.3 | -0.9 |
Notes:
Technical Notes
- Introduction
The National Statistics Office generates various price indices, one of these is the Producer Price Index (PPI). The PPI, a designated statistics, is generated through the results of the Producer Price Survey (PPS) conducted nationwide. The survey gathers monthly producer prices of selected products of establishments included in the market basket.
The PPI is used as a deflator of the Monthly Integrated Survey of Selected Industries (MISSI) to derive indicators for the Volume of Production Index (VoPI) and Volume of Net Sales (VoNSI).
- Method of Index Computation
PPI utilizes the Paasche-type method of index computation. The weights are computed from the value of production to derive concentration ratios from the Census of Philippine Business and Industry (CPBI) or Annual Survey of Philippine Business and Industry (ASPBI). The weights are updated as soon as new results of the ASPBI or CPBI are available and applied at the beginning of each survey year.
For the 2013 PPI, the weights of the major sectors and sub-sectors were computed from the results of the 2010 ASPBI for Manufacturing Establishments with total employment of 20 and over, which is the latest survey results.
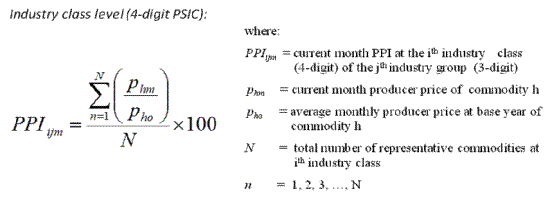
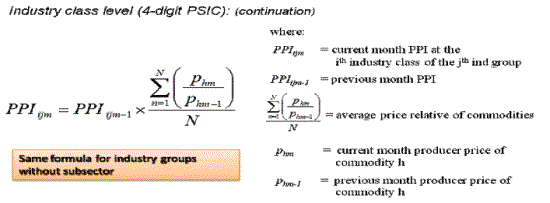
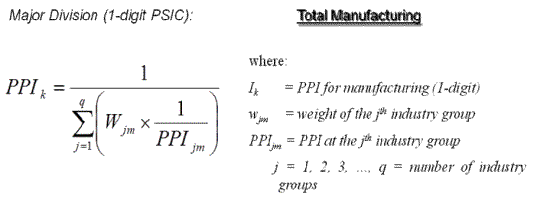
The formulas in the computation of the PPI are as follows:
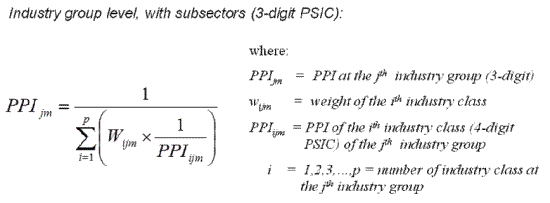
- Industry Coverage
Starting with January 2013 reference month, the PPI utilizes the 2009 Philippine Standard Industry Classification (PSIC) to classify sectors and industries. Twenty industry classes of the 2009 PSIC were grouped to form the industry coverage of the 2013 PPS. These are presented in the table below.
2009 PSIC CODE | INDUSTRY DESCRIPTION |
|---|---|
| 10 | Food manufacturing |
| 11 | Beverages |
| 12 | Tobacco products |
| 13 | Textiles |
| 14,152 | Footwear and wearing apparel |
| 151 | Leather products |
| 16 | Wood and wood products |
| 17 | Paper and paper products |
| 18 | Printing and reproduction of recorded media |
| 19 | Petroleum products |
| 20 | Chemical products |
| 22 | Rubber and plastic products* |
| 23 | Non-metallic mineral products* |
| 24 | Basic metals* |
| 25 | Fabricated metal products |
| 275, 28, 263,268 | Machinery except electrical |
| 26120 and 27 | Electrical machinery |
| 29,30 | Transport equipment |
| 31 | Furniture and fixtures |
| 265,266,267,32 | Miscellaneous manufactures |
| Note: * - Major sectors categorized into sub-sectors | |
- Response Rate
The response rate for August 2013 is 93.8 percent, which corresponds to the retrieval of 300 establishments’ reports out of the 351 samples for the survey. Refer to Table 2.
Table B Response Rates For Total Manufacturing (In Percent) | |
|---|---|
August 2013 | July 2013 (revised) |
93.8 | 94.3r |
(Sgd) CARMELITA N. ERICTA
Administrator