
|
Table A Year-on-Year and Month-on-Month Growth Rates of Producer Price Index: December 2014 and November 2014 |
||
|---|---|---|
|
TOTAL MANUFACTURING |
December
2014
|
November
2014
|
|
Producer Price Index (2000=100) |
147.9 |
149.0 r |
|
Year-on-Year Growth |
-2.9 |
-1.8 r |
|
Month-on-Month Growth |
-0.8 |
-1.1 |
- Producer Price Index decelerates in December 2014
Producer Price Index (PPI, 2000=100) for manufacturing went down by 2.9 percent in December 2014 compared to negative 4.1 percent posted in December 2013. This may be attributed to the double-digit decrements of petroleum products (-27.1%) and basic metals (-11.8%). The downward trend in the producer prices of gasoline, diesel, kerosene and liquefied petroleum gas pushed down the annual rate of petroleum products to its lowest since August 2014. On the other hand, ten out of twenty major sectors reflected increments led by tobacco products (11.4%). Refer to Tables 1 and A-1.
On a monthly basis, PPI decreased by 0.8 percent in December 2014. Nine sectors declined led by petroleum products (-8.0%). Furthermore, five sectors posted increases while six sectors remained flat. Refer to Tables 1 and A-2.
|
Gainers |
Year-on-Year Growth (percent) |
|
|---|---|---|
| December 2014 |
November 2014
(revised)
|
|
|
Food Manufacturing |
2.9 |
3.4 |
|
Transport Equipment |
0.2 |
-0.5 |
|
Tobacco Products |
11.4 |
11.4 |
|
Chemical Products |
1.8 |
2.0 |
|
Beverages |
1.6 |
1.6 |
|
Rubber and Plastic Products |
2.1 |
2.1 |
|
Leather Products |
2.6 |
2.7 |
|
Textiles |
1.0 |
1.1 |
|
Wood and Wood Products |
0.4 |
1.0 |
|
Paper and Paper Products |
1.3 |
1.4 |
|
Printing |
0.0 |
0.0 |
|
Non-Metallic Mineral Products |
0.0 |
0.7 |
|
Losers |
Year-on-Year Growth (percent) |
|
|---|---|---|
| December 2014 |
November 2014
(revised)
|
|
|
Petroleum Products |
-27.1 |
-15.6 |
|
Electrical Machinery |
-1.1 |
0.4 |
|
Basic Metals |
-11.8 |
-9.9 |
|
Machinery Except Electrical |
-6.9 |
-5.2 |
|
Fabricated Metal Products |
-4.8 |
-5.1 |
|
Miscellaneous Manufactures |
-5.9 |
-4.6 |
|
Footwear and Wearing Apparel |
-3.4 |
-2.8 |
|
Furniture and fixtures |
-8.3 |
-12.5 |
|
Gainers |
Month-on-Month Growth (percent) |
|
|---|---|---|
|
December 2014 |
November 2014
(revised)
|
|
|
Furniture and Fixtures |
3.7 |
-8.5 |
|
Food Manufacturing |
0.1 |
-0.2 |
|
Transport Equipment |
0.1 |
1.4 |
|
Chemical Products |
0.1 |
-0.2 |
|
Rubber and Plastic Products |
0.3 |
0.0 |
|
Beverages |
0.0 |
0.0 |
|
Fabricated Metal Products |
0.0 |
-1.1 |
|
Printing |
0.0 |
0.0 |
|
Tobacco |
0.0 |
0.0 |
|
Losers |
Month-on-Month Growth (percent) |
|
|---|---|---|
| December 2014 |
November 2014
(revised)
|
|
|
Petroleum Products |
-8.0 |
-5.0 |
|
Electrical Machinery |
-1.7 |
-2.5 |
|
Basic Metals |
-1.1 |
-0.4 |
|
Machinery Except Electrical |
-0.6 |
0.1 |
|
Non-Metallic Mineral Products |
-1.1 |
-0.7 |
|
Miscellaneous Manufactures |
-1.2 |
1.5 |
|
Paper and Paper Products |
-0.4 |
-0.1 |
|
Wood & Wood Products |
-0.5 |
-1.2 |
|
Footwear and Wearing Apparel |
-0.1 |
0.0 |
|
Textiles |
b/ |
0.0 |
|
Leather Products |
b/ |
0.0 |
- Introduction
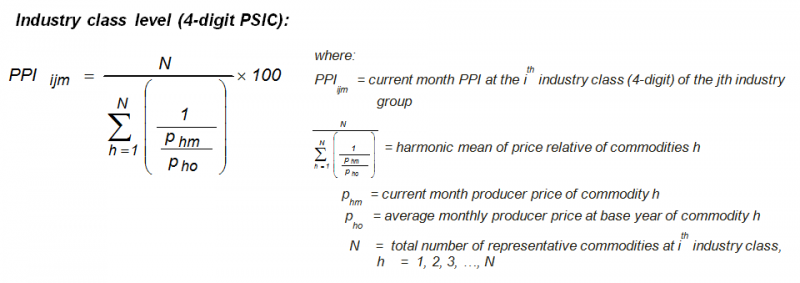
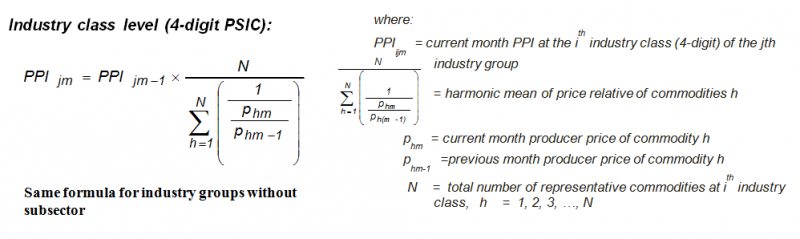
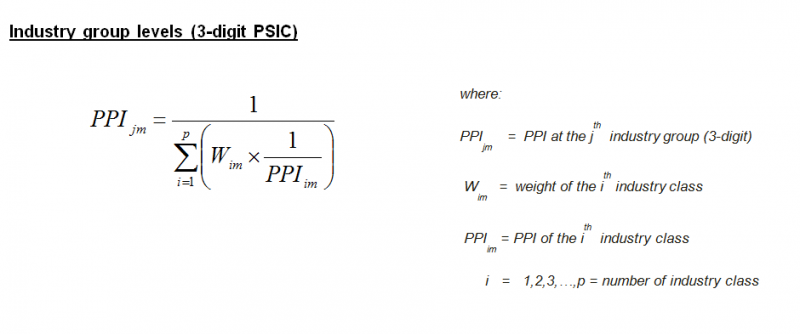
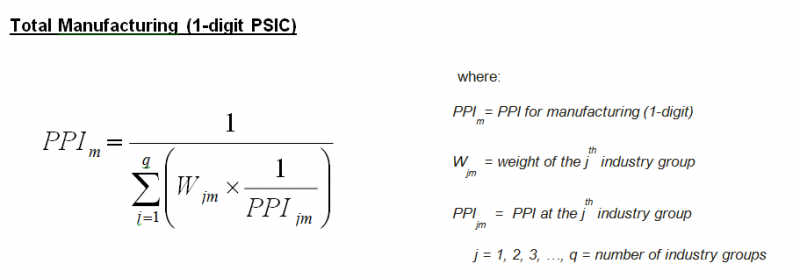
- Method of Index Computation
- Industry Coverage
Starting with January 2013 reference month, the PPI utilizes the 2009 Philippine Standard Industry Classification (PSIC) to classify sectors and industries. Selected industry classes of the 2009 PSIC were grouped to form the 20 industry groupings of the 2014 PPS. These are presented in the table below.
|
2009 PSIC CODE |
INDUSTRY DESCRIPTION |
|---|---|
|
C10 |
Food manufacturing * |
|
C11 |
Beverages |
|
C12 |
Tobacco products |
|
C13 |
Textiles* |
|
C14,C152 |
Footwear and wearing apparel |
|
C151 |
Leather products |
|
C16 |
Wood and wood products* |
|
C17 |
Paper and paper products |
|
C18 |
Printing and reproduction of recorded media |
|
C19 |
Petroleum products* |
|
C20,C21 |
Chemical products* |
|
C22 |
Rubber and plastic products* |
|
C23 |
Non-metallic mineral products* |
|
C24 |
Basic Metals* |
|
C25 |
Fabricated metal products |
|
C262,C275,C28,C263,C268 |
Machinery except electrical* |
|
C261,C264,C27,C29301 |
Electrical machinery* |
|
C29 except C29301,C30 |
Transport equipment |
|
C31 |
Furniture and fixtures |
|
C265,C266,C267,C32 |
Miscellaneous manufactures |
Note: * - Major sectors categorized into sub-sectors
- Response Rate
The response rate for December 2014 is 83.5 percent, which corresponds to the retrieval of 299 establishments’ reports out of the 358 samples for the survey. Refer to Table B.
|
Table B Response Rates For Total Manufacturing
(In Percent)
|
|
|---|---|
|
December 2014 |
November 2014
(revised)
|
|
83.5 |
95.5r |
Missing prices for products of sample establishments are estimated using the short-term relative change of all available prices within the same industry class. Revisions to the preliminary estimates are done upon receipt of actual reports from late respondents.
| Attachment | Size |
|---|---|
|
|
85.41 KB |
|
|
33.21 KB |