
- Producer Price Index decelerates
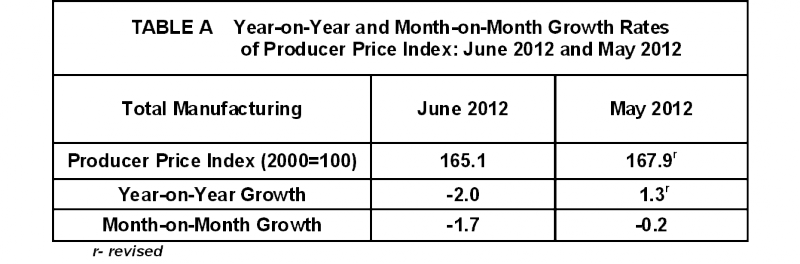
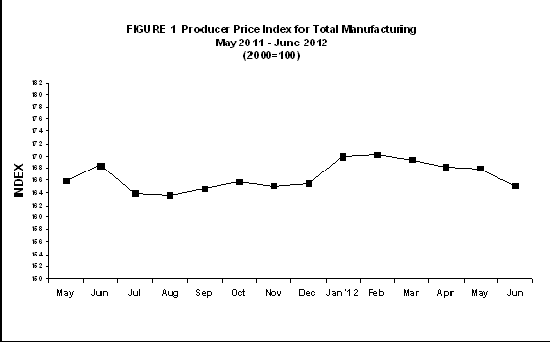
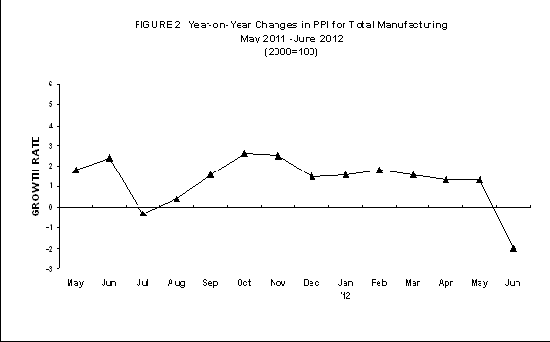
Producer Price Index (PPI, 2000=100) for the manufacturing sector went down to -2.0 percent in June 2012 from 1.3 percent in May, according to the preliminary results of the monthly Producer Price Survey. The downtrend was influenced by the double-digit decreases posted by three major sectors namely: furniture and fixtures (-14.8%); basic metals (-14.1%) and non-metallic mineral products (-13.5%). On the other hand, four major sectors posted increases led by rubber and plastic products (6.0%) while publishing and printing showed a flat growth. Refer to Tables 1 and 1-B.
Moreover, on a monthly basis, PPI further decreased to -1.7 percent in June 2012 from -0.2 percent in May 2012. Twelve major sectors posted decreasing producer prices led by petroleum products (-9.3%); machinery except electrical (-5.5%); non-metallic mineral products (-2.6%) and paper and paper products (-2.6%) .On the other hand, three major sectors posted increase in producer prices and four reflected flat growths. Refer to Tables 1 and 1-B.
TECHNICAL NOTES
- Introduction
The National Statistics Office generates various price indices, one of this is the Producer Price Index. (PPI). The PPI is generated through the results of the Producers Price Survey (PPS) conducted nationwide. The survey gathers monthly actual producer prices of selected products included in the market basket.
The PPI is the deflator of the Monthly Integrated Survey of Selected Industries (MISSI) to derive indicators for the Volume of Production Index (VoPI) and Volume of Net Sales Index (VoNSI).
- Method of Index Computation
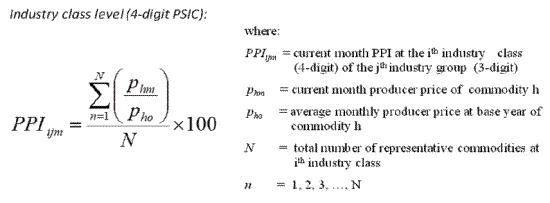
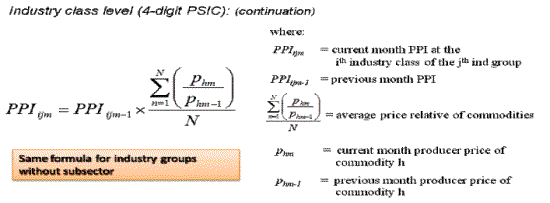
PPI utilizes the Paasche-type method of index computation. The weights are computed from the value of production to derive concentration ratios from the Census of Philippine Business and Industry (CPBI) or Annual Survey of Philippine Business and Industry (ASPBI). The weights are updated as soon as new results of the ASPBI or CPBI are available and applied at the beginning of each survey year.
For the 2012 PPI, the weights of the major sectors and sub-sectors were computed from the results of the 2009 ASPBI for Manufacturing Establishments with total employment of 20 and over, which is the latest survey results.
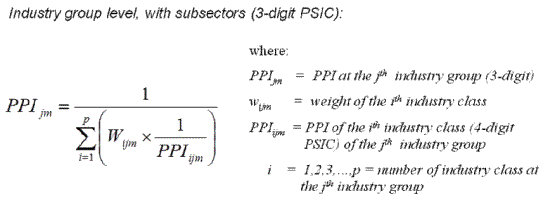
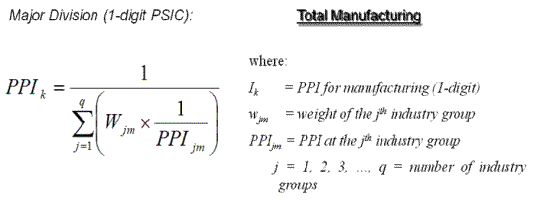
The formulas in the computation of the PPI are as follows:
- Industry Coverage
The industry classification of the 2012 PPI utilizes the amended 1994 Philippine Standard Industry classification. There are 20 major sectors covered by the 2012 PPS with three consisting of subsectors.
| 1994 PSIC CODE | INDUSTRY DESCRIPTION |
|---|---|
| 15 except 155 | Food Manufacturing |
| 155 | Beverages |
| 16 | Tobacco products |
| 17 | Textiles |
| 18,174 and 192 | Footwear and wearing apparel |
| 191 | Leather products |
| 20 | Wood and wood products |
| 21 | Paper and paper products |
| 22 | Publishing and printing |
| 23 | Petroleum products |
| 24 | Chemical products |
| 25 | Rubber and plastic products* |
| 26 | Non-metallic mineral products* |
| 27 | Basic metals* |
| 28 | Fabricated metal products |
| 29 and 30 | Machinery except electrical |
| 31 and 32 | Electrical machinery |
| 34 and 35 | Transport equipment |
| 36 | Furniture and fixtures |
| 33, 37 and 39 | Miscellaneous manufactures |
Note: * - Major sectors categorized into sub-sectors
The response rate for June 2012 is 90.9 percent, which corresponds to the retrieval of 300 sample establishments' reports. Refer to Table 2.
Non-responding sample establishments are estimated using cold-deck imputation method. Revisions to the preliminary estimates are done upon receipt of actual reports from late respondents.
TABLE 1-A. PRODUCER PRICE INDEX, MAY 2012 - JUNE 2012
TABLE 1-B. PRODUCER PRICE INDEX, MAY 2012 - JUNE 2012
Note: Sectors are ranked according to their contribution to the overall 2000-based growth rate. a/ - Less than 0.1 percent increase b/ - Less than 0.1 percent decrease Year-on-year growth rates are computed by dividing the current month index by previous year same month index less 1. Month-on-month growth rates are computed by dividing the current month index by previous month index less 1 Source: National Statistics Office
| ||||||||||||||||||||||||||||||||||||||||||||||||||||||||||||||||||||||||||||||||||||||||||||||||||||||||||||||||||||||||||||||||||||||||||||||||||||||||||||||||||||||||
| Attachment | Size |
|---|---|
|
|
58.94 KB |
|
|
23.19 KB |