
|
Table A Year-on-Year and Month-on-Month Growth Rates of Producer Price Index:
October 2016, September 2016 and October 2015
|
|||
|---|---|---|---|
|
TOTAL MANUFACTURING |
October
2016
|
September
2016
|
October
2015
|
|
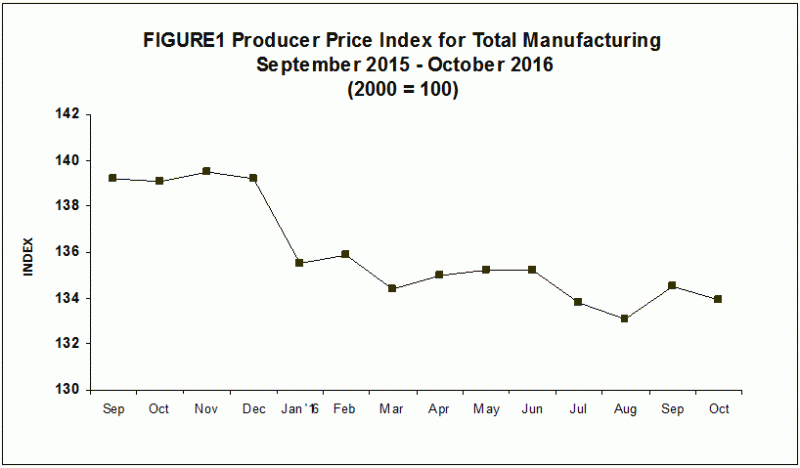
Producer Price Index (2000=100) |
133.9 |
134.5 r |
139.1 |
|
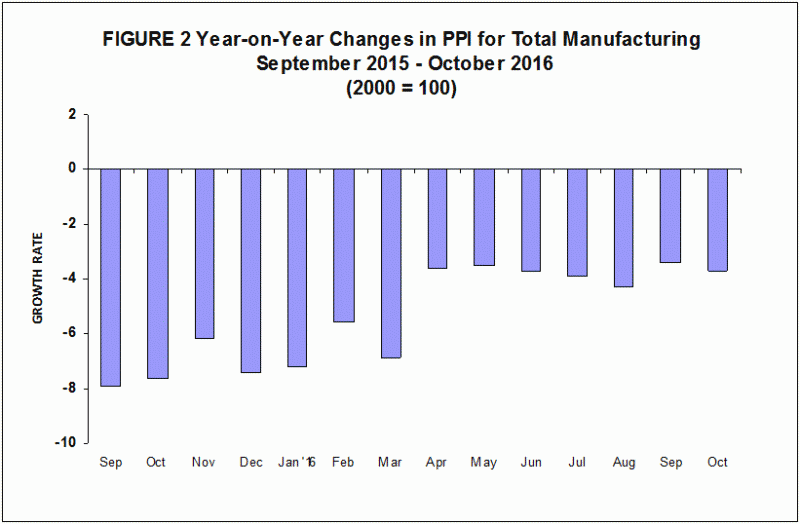
Year-on-Year Growth |
- 3.7 |
- 3.4 r |
- 7.6 |
|
Month-on-Month Growth |
- 0.4 |
1.0 r |
- 0.1 |
- Producer Price Index continues to post a negative rate in October 2016
The Producer Price Index (PPI, 2000=100) for manufacturing slowly declined by 3.7 percent in October 2016 from the negative 7.6 percent during the same period last year. The slowdown resulted mainly from the significant decreases of three major sectors namely: furniture and fixtures (-19.6%), machinery except electrical (-12.6%) and leather products (-10.1%). Contributing also to the downtrend were the decrements in the other ten major sectors. On the other hand, miscellaneous manufactures (6.9%) led the seven sectors that posted increases. Refer to Tables 1 and A-1.
On a monthly basis, the PPI pulled back sharply by 0.4 percent in October after an increase of 1.0 percent a month earlier. Five sectors pulled down the overall month-on-month performance of the PPI led by the heavily-weighted electrical machinery (-2.7%). On the other hand, nine major sectors reflected increases while six sectors posted flat growths. Refer to Tables 1 and A-2.
|
Gainers |
Year-on-Year Growth (percent) |
|
|---|---|---|
| October 2016 |
September 2016
(revised)
|
|
|
Food Manufacturing |
2.4 |
2.0 |
|
Beverages |
4.3 |
4.3 |
|
Miscellaneous Manufactures |
6.9 |
5.5 |
|
Non-Metallic Mineral Products |
1.9 |
2.1 |
|
Wood and Wood Products |
3.5 |
-1.9 |
|
Tobacco Products |
0.1 |
0.1 |
|
Textiles |
a/ |
0.2 |
|
Losers |
Year-on-Year Growth (percent) |
|
|---|---|---|
| October 2016 |
September 2016
(revised)
|
|
|
Machinery except Electrical |
-12.6 |
-13.3 |
|
Petroleum Products |
-5.9 |
-10.4 |
|
Electrical Machinery |
-2.8 |
-1.3 |
|
Basic Metals |
-6.2 |
-5.8 |
|
Transport Equipment |
-1.4 |
-0.9 |
|
Furniture and fixtures |
-19.6 |
-19.4 |
|
Rubber and Plastic Products |
-1.3 |
-1.7 |
|
Chemical Products |
-0.6 |
-1.4 |
|
Footwear and Wearing Apparel |
-2.3 |
-3.6 |
|
Leather Products |
-10.1 |
-10.5 |
|
Paper and Paper Products |
-0.6 |
-1.4 |
|
Fabricated Metal Products |
-0.4 |
-0.7 |
|
Printing |
-0.6 |
-0.7 |
|
Gainers |
Month-on-Month Growth (percent) |
|
|---|---|---|
| October 2016 |
September 2016
(revised)
|
|
|
Petroleum Products |
4.1 |
0.2 |
|
Machinery except Electrical |
0.5 |
3.4 |
|
Chemical Products |
0.3 |
0.3 |
|
Food Manufacturing |
a/ |
b/ |
|
Rubber and Plastic Products |
0.1 |
0.4 |
|
Footwear and Wearing Apparel |
0.2 |
1.3 |
|
Fabricated Metal Products |
0.1 |
1.2 |
|
Miscellaneous Manufactures |
0.1 |
2.2 |
|
Leather Products |
0.2 |
7.0 |
|
Textiles |
0.0 |
0.2 |
|
Furniture and Fixtures |
0.0 |
1.6 |
|
Printing |
0.0 |
0.1 |
|
Beverages |
0.0 |
0.0 |
|
Tobacco Products |
0.0 |
0.0 |
|
Wood and Wood Products |
0.0 |
0.3 |
|
Losers |
Month-on-Month Growth (percent) |
|
|---|---|---|
| October 2016 |
September 2016
(revised)
|
|
|
Electrical Machinery |
-2.7 |
1.3 |
|
Basic Metals |
-0.5 |
0.6 |
|
Non-Metallic Mineral Products |
-0.3 |
0.9 |
|
Transport Equipment |
b/ |
0.3 |
|
Paper and Paper Products |
b/ |
-0.2 |
- Introduction
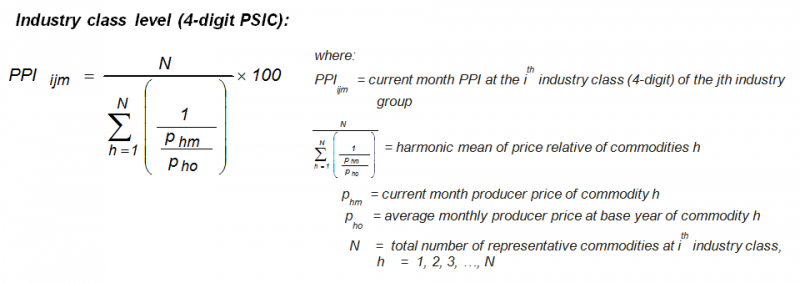
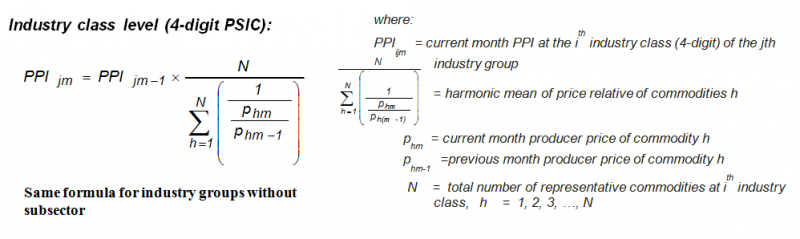
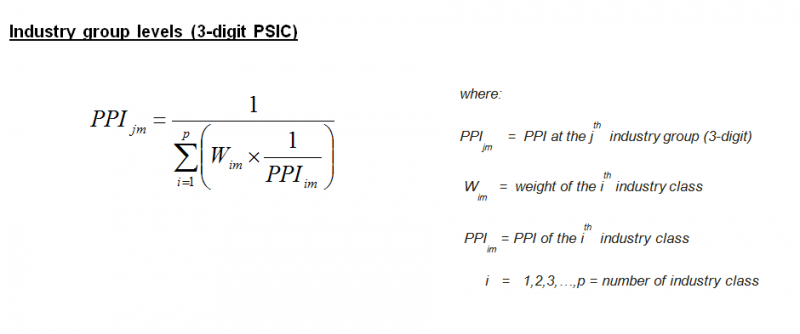
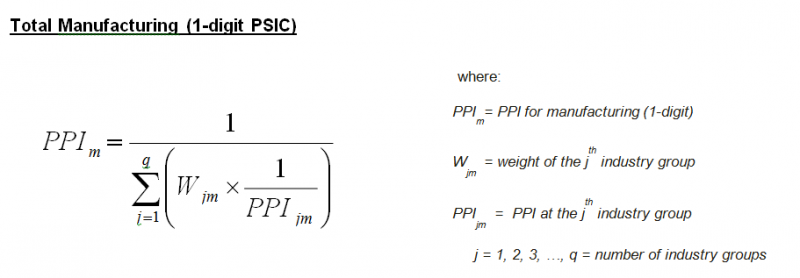
- Method of Index Computation
- Industry Coverage
Starting with January 2013 reference month, the PPI utilizes the 2009 Philippine Standard Industrial Classification (PSIC) to classify sectors and industries. Selected industry classes of the 2009 PSIC were grouped to form the 20 industry groupings of the 2016 PPS. These are presented in the table below.
|
2009 PSIC CODE |
INDUSTRY DESCRIPTION |
|---|---|
|
C10 |
Food manufacturing * |
|
C11 |
Beverages |
|
C12 |
Tobacco products |
|
C13 |
Textiles* |
|
C14,C152 |
Footwear and wearing apparel |
|
C151 |
Leather products |
|
C16 |
Wood and wood products* |
|
C17 |
Paper and paper products |
|
C18 |
Printing and reproduction of recorded media |
|
C19 |
Petroleum products* |
|
C20,C21 |
Chemical products* |
|
C22 |
Rubber and plastic products* |
|
C23 |
Non-metallic mineral products* |
|
C24 |
Basic Metals* |
|
C25 |
Fabricated metal products |
|
C262,C275,C28,C263,C268 |
Machinery except electrical* |
|
C261,C264,C27,C29301 |
Electrical machinery* |
|
C29 except C29301,C30 |
Transport equipment |
|
C31 |
Furniture and fixtures |
|
C265,C266,C267,C32 |
Miscellaneous manufactures |
Note: * - Major sectors categorized into sub-sectors
- Response Rate
The response rate for October 2016 is 80.2 percent, which corresponds to the retrieval of 604 establishments’ reports out of the 753 samples for the survey. Refer to Tables 2 and B.
|
Table B Response Rates For Total Manufacturing
(In Percent)
|
|
|---|---|
|
October 2016 |
September 2016
(revised)
|
|
80.2 |
90.3 r |
Missing prices for products of sample establishments are estimated using the short-term geometric mean of the actual prices of responding samples within the same industry class. Revisions to the preliminary estimates are done upon receipt of actual reports from late responding establishments.
| Attachment | Size |
|---|---|
|
|
109 KB |
|
|
83.14 KB |