
Year-on-Year
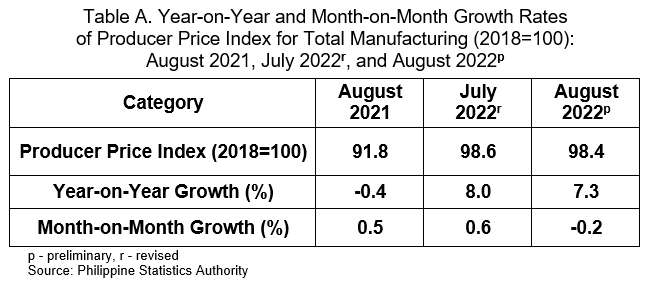
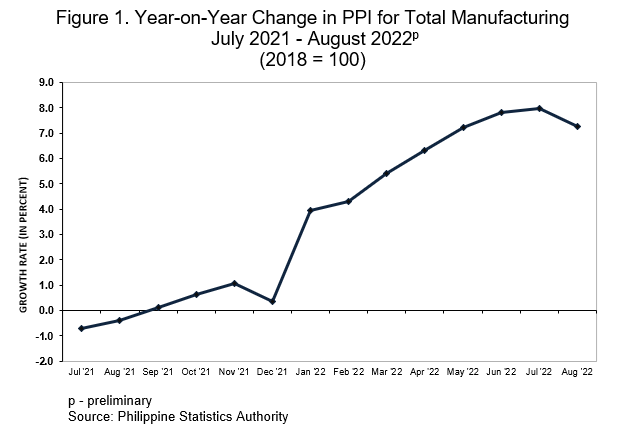
The Producer Price Index (PPI) for manufacturing posted a slower annual rate of 7.3 percent in August 2022 compared with the annual increment of 8.0 percent last July 2022. In August 2021, the PPI dropped with an annual rate of -0.4 percent. (Table A and 1)
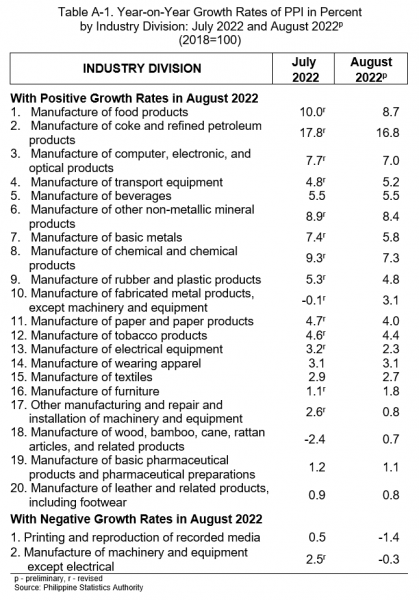
The increase in the PPI in August 2022 can be attributed to the annual increments in the indices of 20 industry divisions led by manufacture of coke and refined petroleum products, which registered an annual growth of 16.8 percent.
On the contrary, the two industry divisions that exhibited decrements were printing and reproduction of recorded media and manufacture of machinery and equipment except electrical with annual growth rates of -1.4 percent and -0.3 percent, respectively. (Tables A-1 and 1)
Month-on-Month
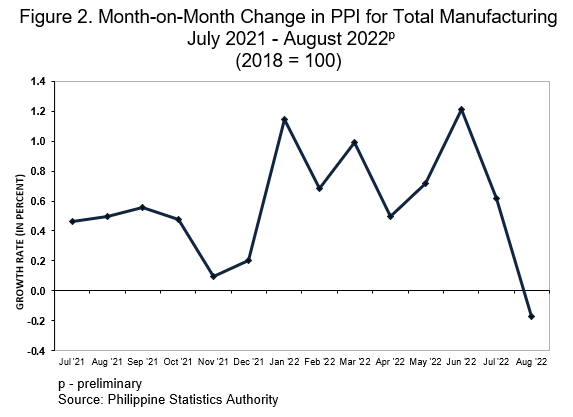
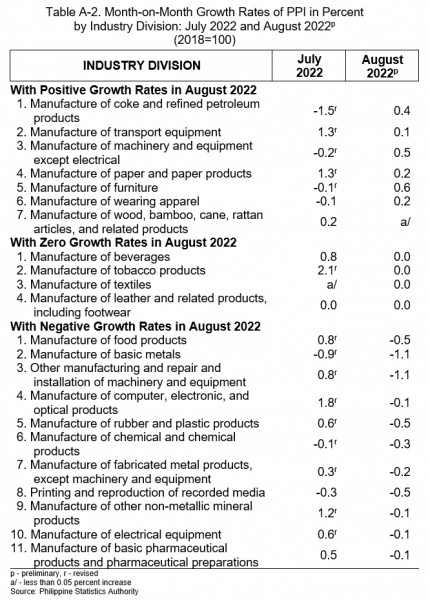
Month-on-month, the PPI for manufacturing posted a downturn in August 2022 with a -0.2 percent growth rate compared with the 0.6 percent increase in July 2022. In August 2021, the PPI recorded a monthly increment of 0.5 percent. (Table A and 1)
Half of the 22 industry divisions registered negative monthly growth rates in August 2022 led by other manufacturing and repair and installation of machinery and equipment and manufacture of basic metals both recording a monthly decrease of -1.1 percent.
On the other hand, the PPI of seven industry divisions exhibited monthly upturns with manufacture of furniture posting the highest increase of 0.6 percent. Meanwhile, the monthly growth rates of four industry divisions were at 0.0 percent. (Tables A-2 and 1)
Manufacture of food products
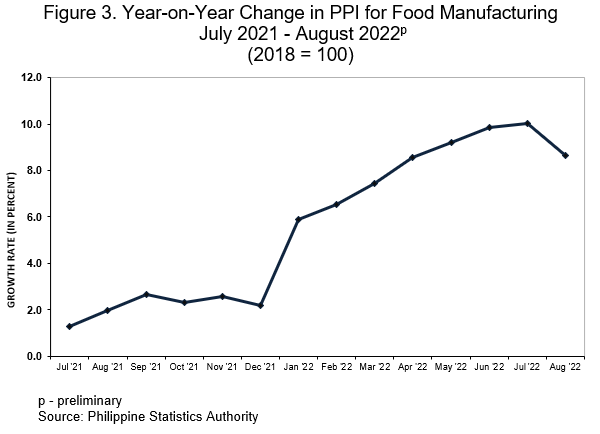
The PPI for the manufacture of food products posted a slower growth with an annual rate of 8.7 percent in August 2022, compared with the previous month’s annual rate of 10.0 percent.
The increment in August 2022 was attributed by the annual increases in the PPI of seven industry groups under the manufacture of food products. Moreover, double-digit upturns were registered in the three industry groups, namely: manufacture of grain mill products, starches and starch products (17.7%), manufacture of prepared animal feeds (14.9%), and processing and preserving of fish, crustaceans and mollusks (12.8%). (Tables 1 and 2)
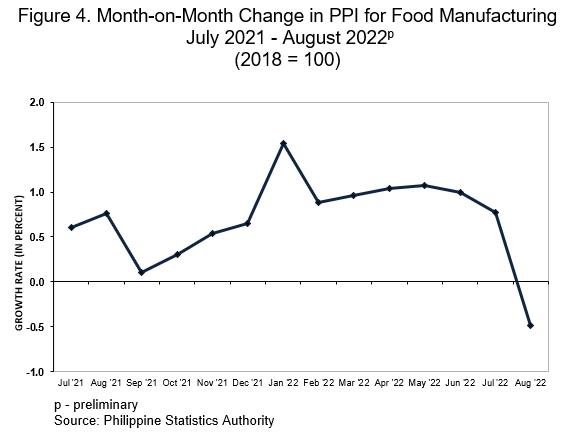
On a month-on-month basis, the PPI for the manufacture of food products exhibited downward trend with a monthly growth rate of -0.5 percent in August 2022. In July 2022, it increased by 0.8 percent. Four of the eight industry groups contributed to the decrease of the PPI for the manufacture of food products led by processing and preserving of fruits and vegetables posting a monthly rate of -3.8 percent. (Tables 1 and 2)
DENNIS S. MAPA, Ph.D.
Undersecretary
National Statistician and Civil Registrar General
- Introduction
- Method of Index Computation
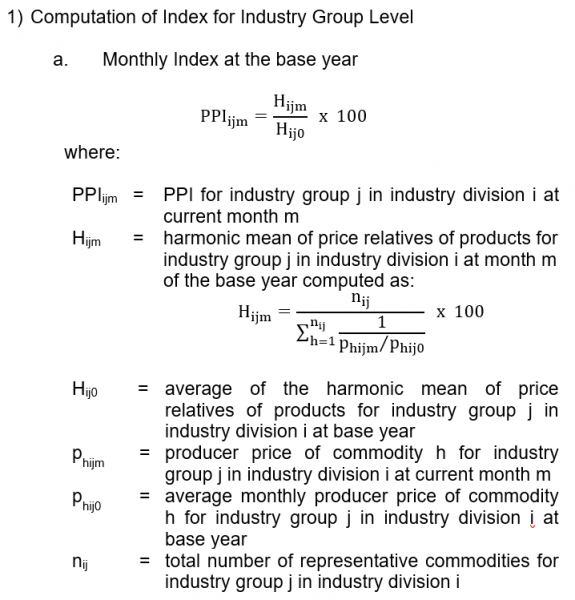
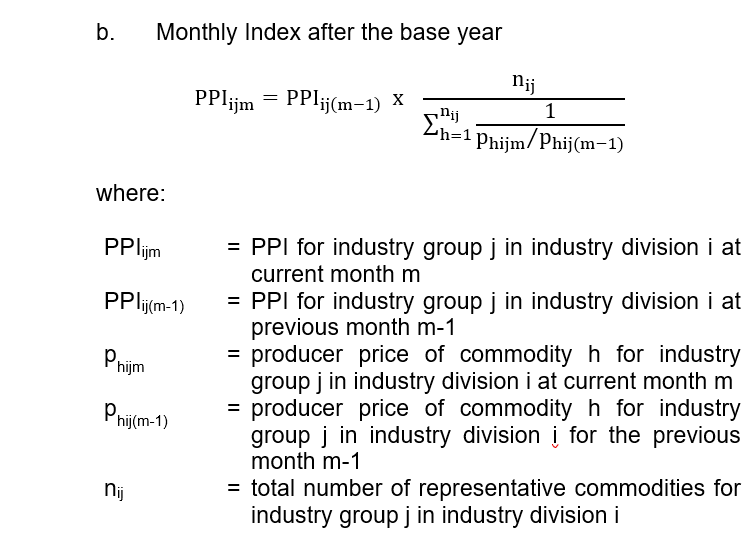
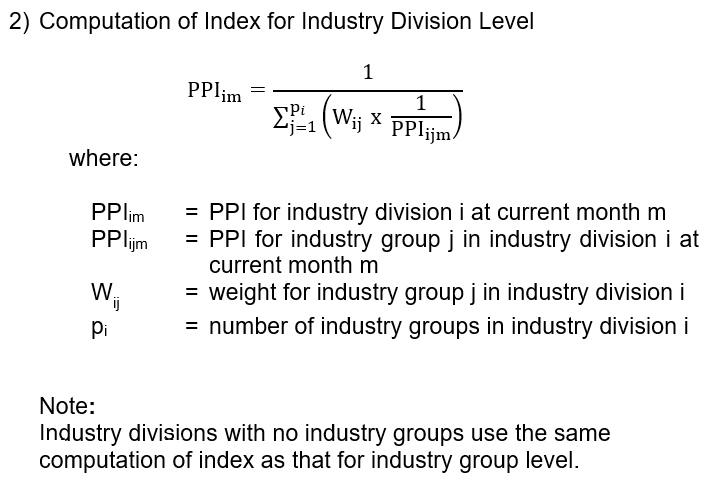
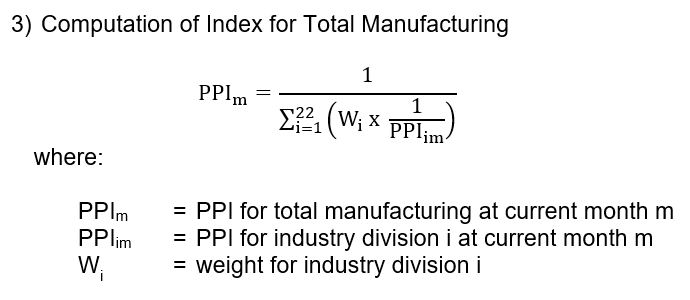
Note: A link factor has been used to adjust weight effects to measure the correct price change.
- Computation of Growth Rates
Year-on-year growth rates are computed by dividing the current month’s index by the index of the same month of the previous year less 1.
Month-on-month growth rates are computed by dividing the current month’s index by the previous month’s index less 1.
- Imputation and Revision
Imputation is done for sample establishments that are in operation during the reference period but with no received response during the release date. Results are revised accordingly when the actual data are received, and these revisions are reflected in the next release.
- Industry Coverage
Starting with the January 2013 reference month, PPI utilizes the 2009 Philippine Standard Industrial Classification (PSIC) to classify sectors and industries. Selected industry groups of the 2009 PSIC were grouped to form the 22 industry divisions of the 2021 PPS. These are presented in the table below.
|
2009 PSIC CODE |
INDUSTRY DESCRIPTION |
|---|---|
|
C10 |
Manufacture of food products * |
|
C11 |
Manufacture of beverages |
|
C12 |
Manufacture of tobacco products |
|
C13 |
Manufacture of Textiles |
|
C14 |
Manufacture of wearing apparel |
|
C15 |
Manufacture of leather and related products, including footwear |
|
C16 |
Manufacture of wood, bamboo, cane, rattan articles, and related products products* |
|
C17 |
Manufacture of paper and paper products |
|
C18 |
Printing and reproduction of recorded media |
|
C19 |
Manufacture of coke and refined petroleum products |
|
C20 |
Manufacture of chemical and chemical products* |
|
C21 |
Manufacture of basic pharmaceutical products and pharmaceutical preparations |
|
C22 |
Manufacture of rubber and plastic products* |
|
C23 |
Manufacture of other non-metallic mineral products* |
|
C24 |
Manufacture of basic metals* |
|
C25 |
Manufacture of fabricated metal products, except machinery and equipment* |
|
C26 |
Manufacture of computer, electronic, and optical products* |
|
C27 |
Manufacture of electrical equipment* |
|
C28 |
Manufacture of machinery and equipment except electrical* |
|
C29, C30 |
Manufacture of transport equipment* |
| C31 | Manufacture of furniture |
| C32, C33 | Other manufacturing |
* Industry divisions categorized further into industry groups
See more at the Producer Price Survey (PPS) main page.